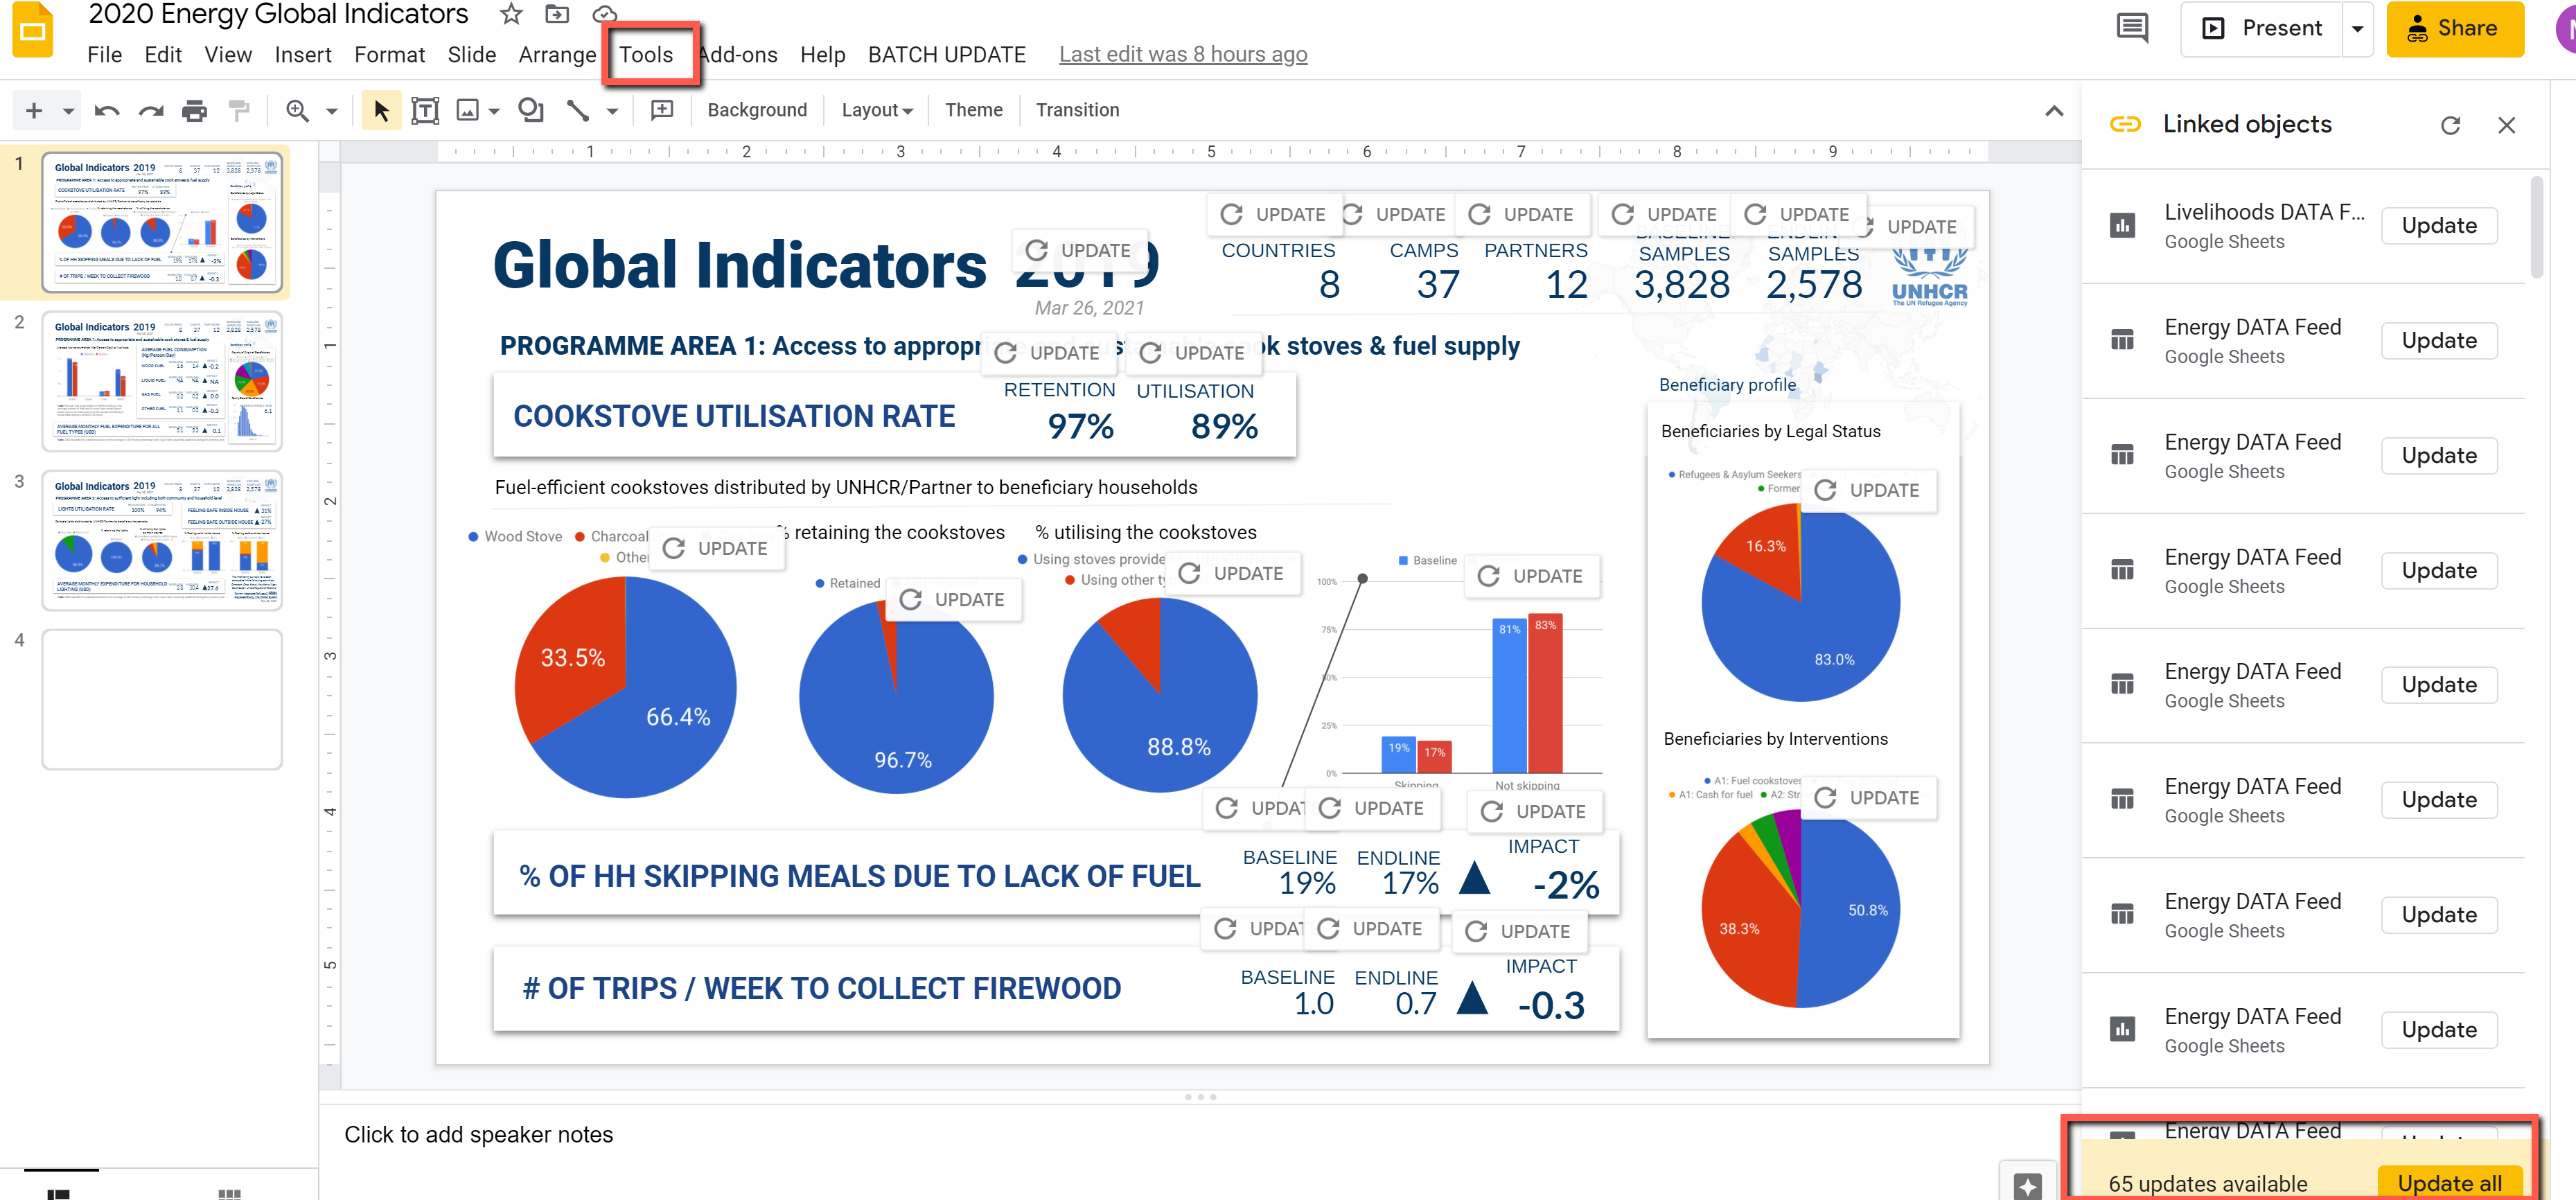
Updating the Global Indicators
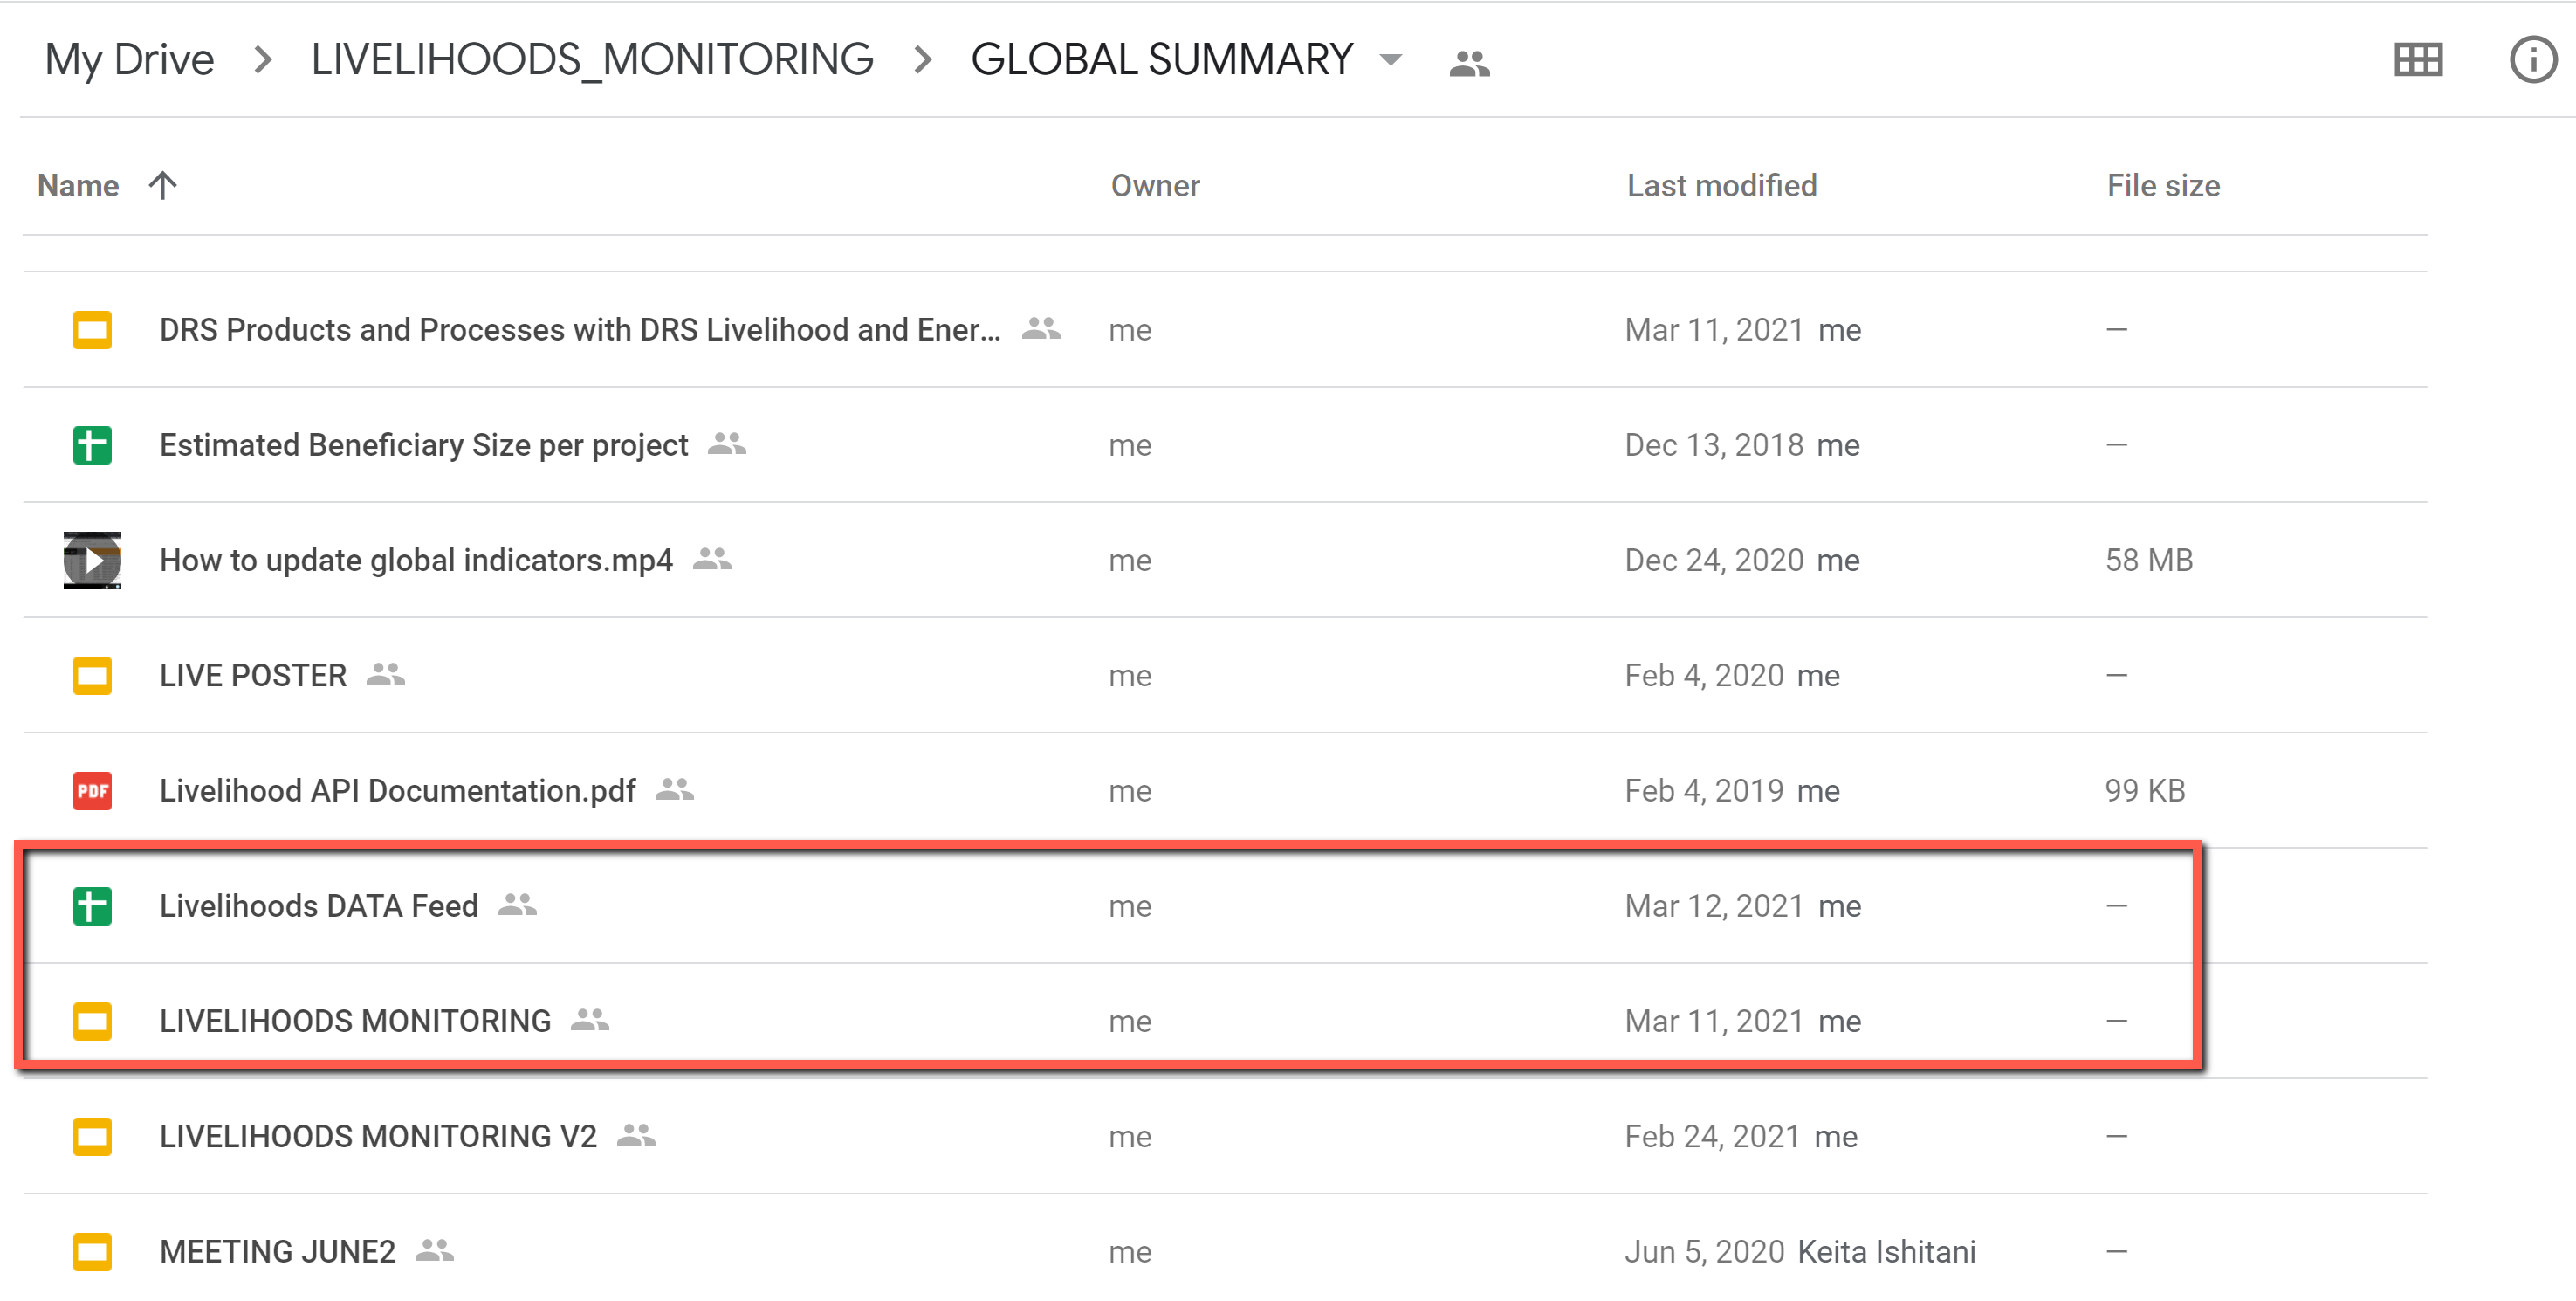
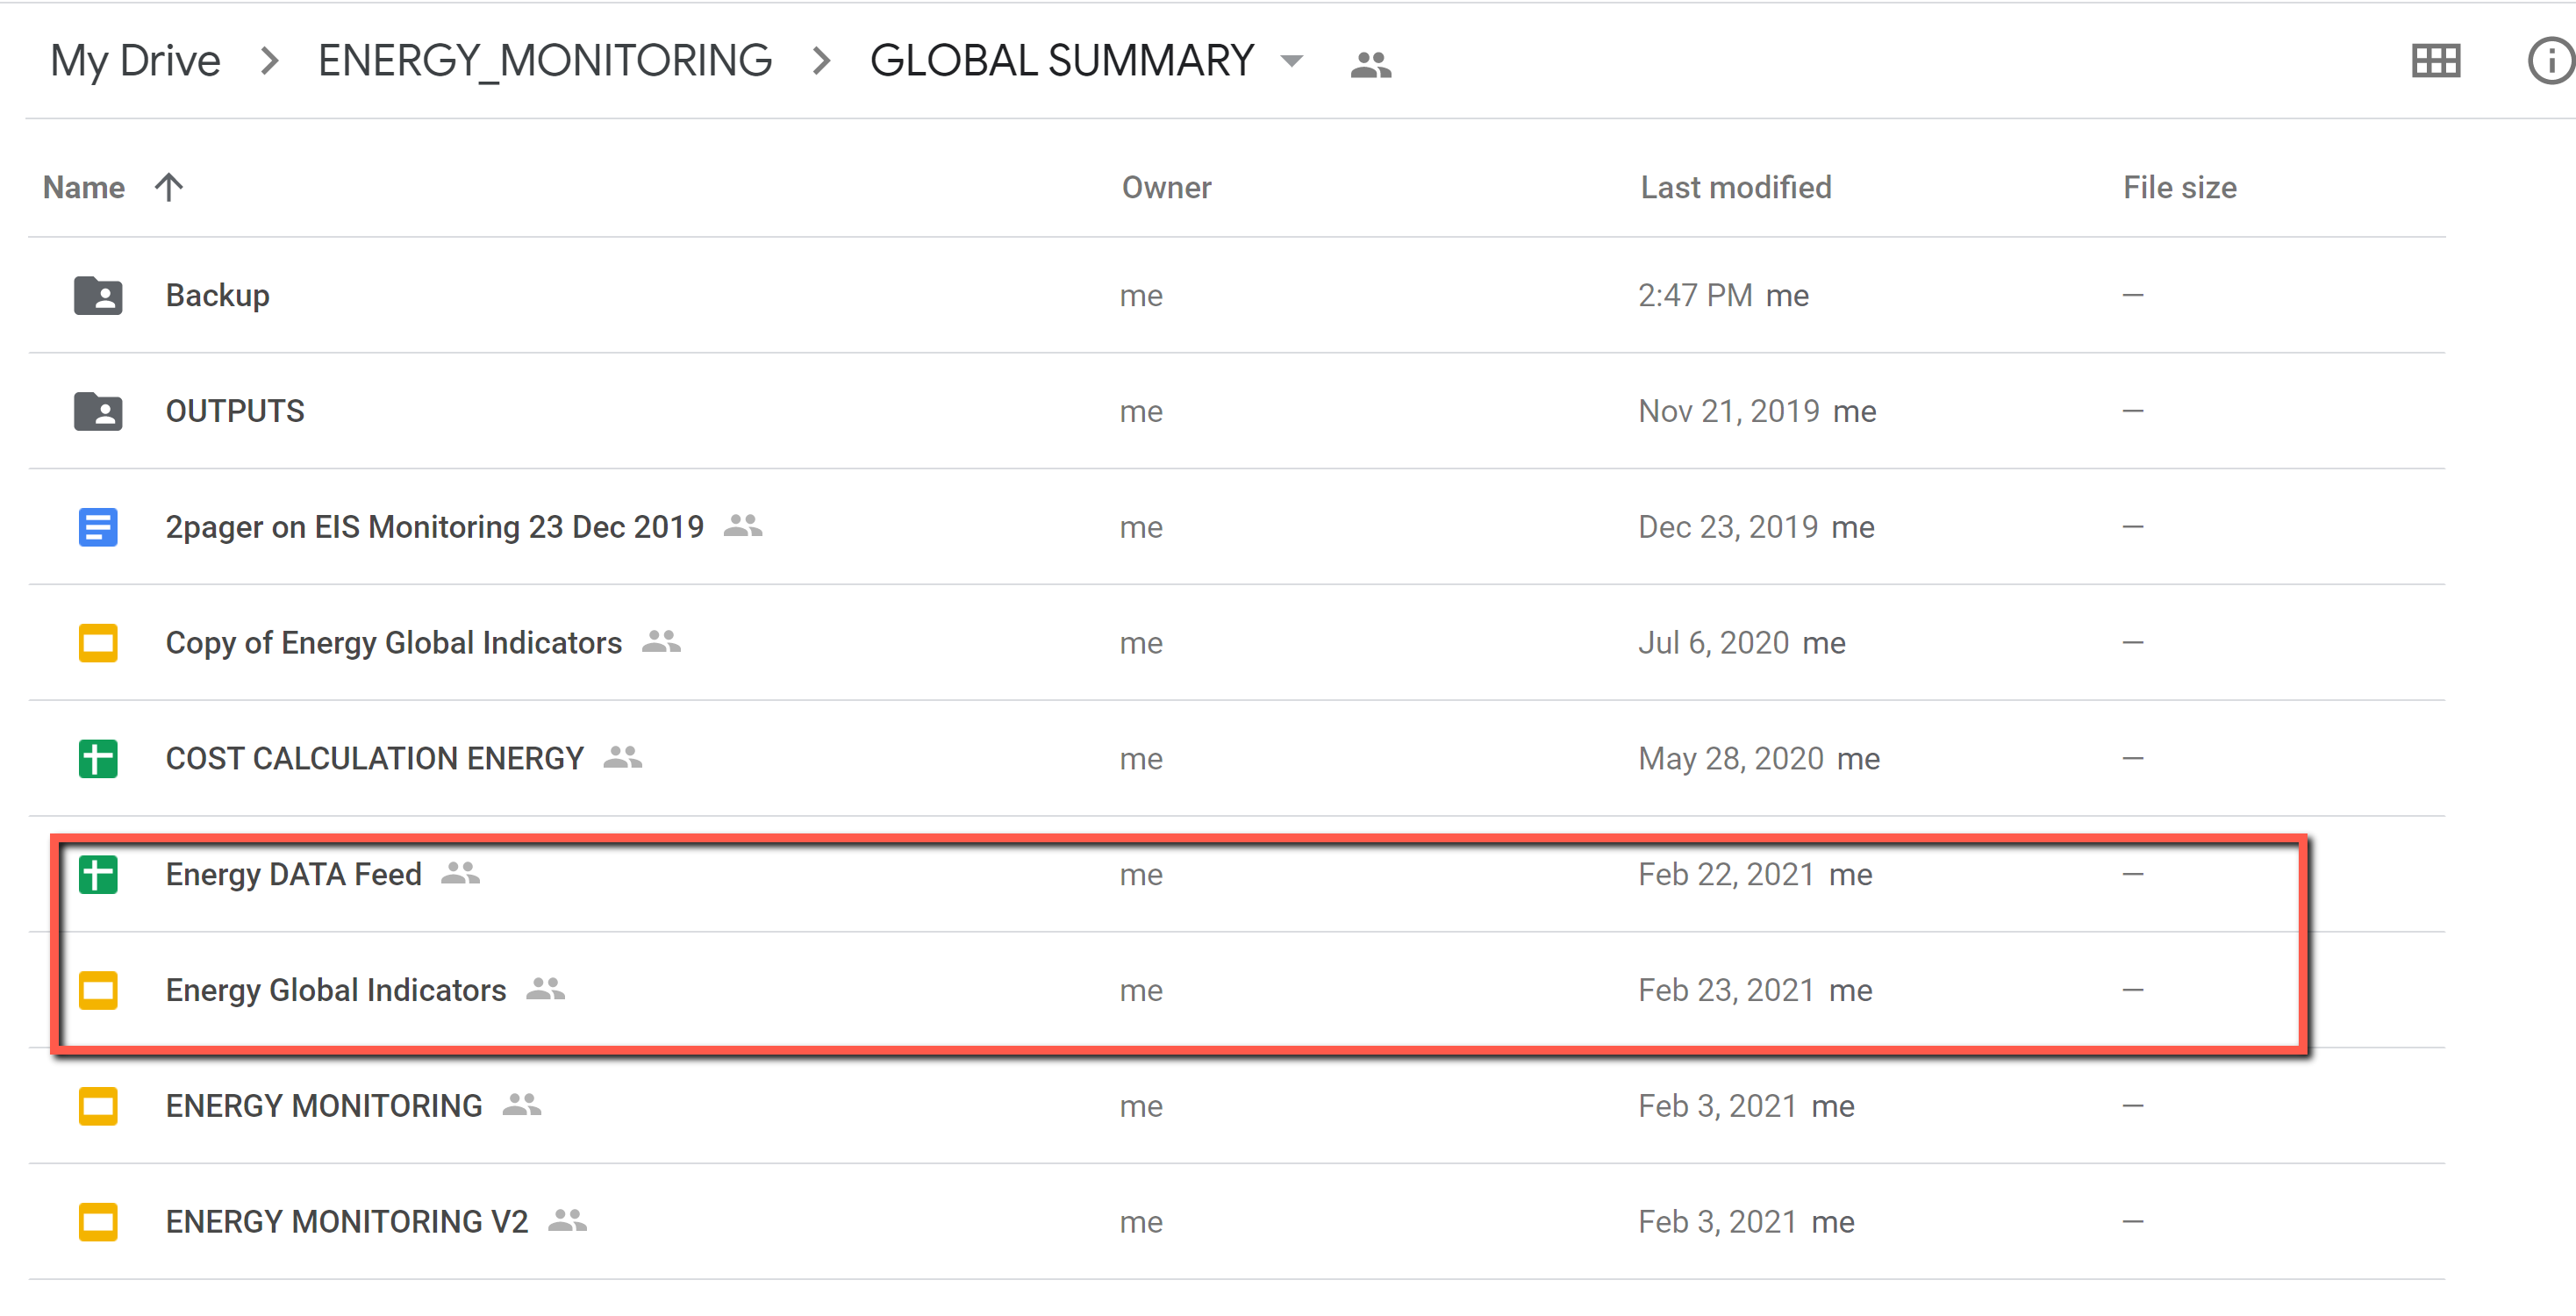
Please go to GLOBAL SUMMARY Folder and find a data feed file.
Note
Data feed is a main source file used for updating the charts in the presentation
Note
Livelihoods > Livelihoods Monitoring Folder > GLOBAL SUMMARY> Livelihoods DATA feed
Note
Energy > Energy Monitoring Folder > GLOBAL SUMMARY> Energy DATA feed
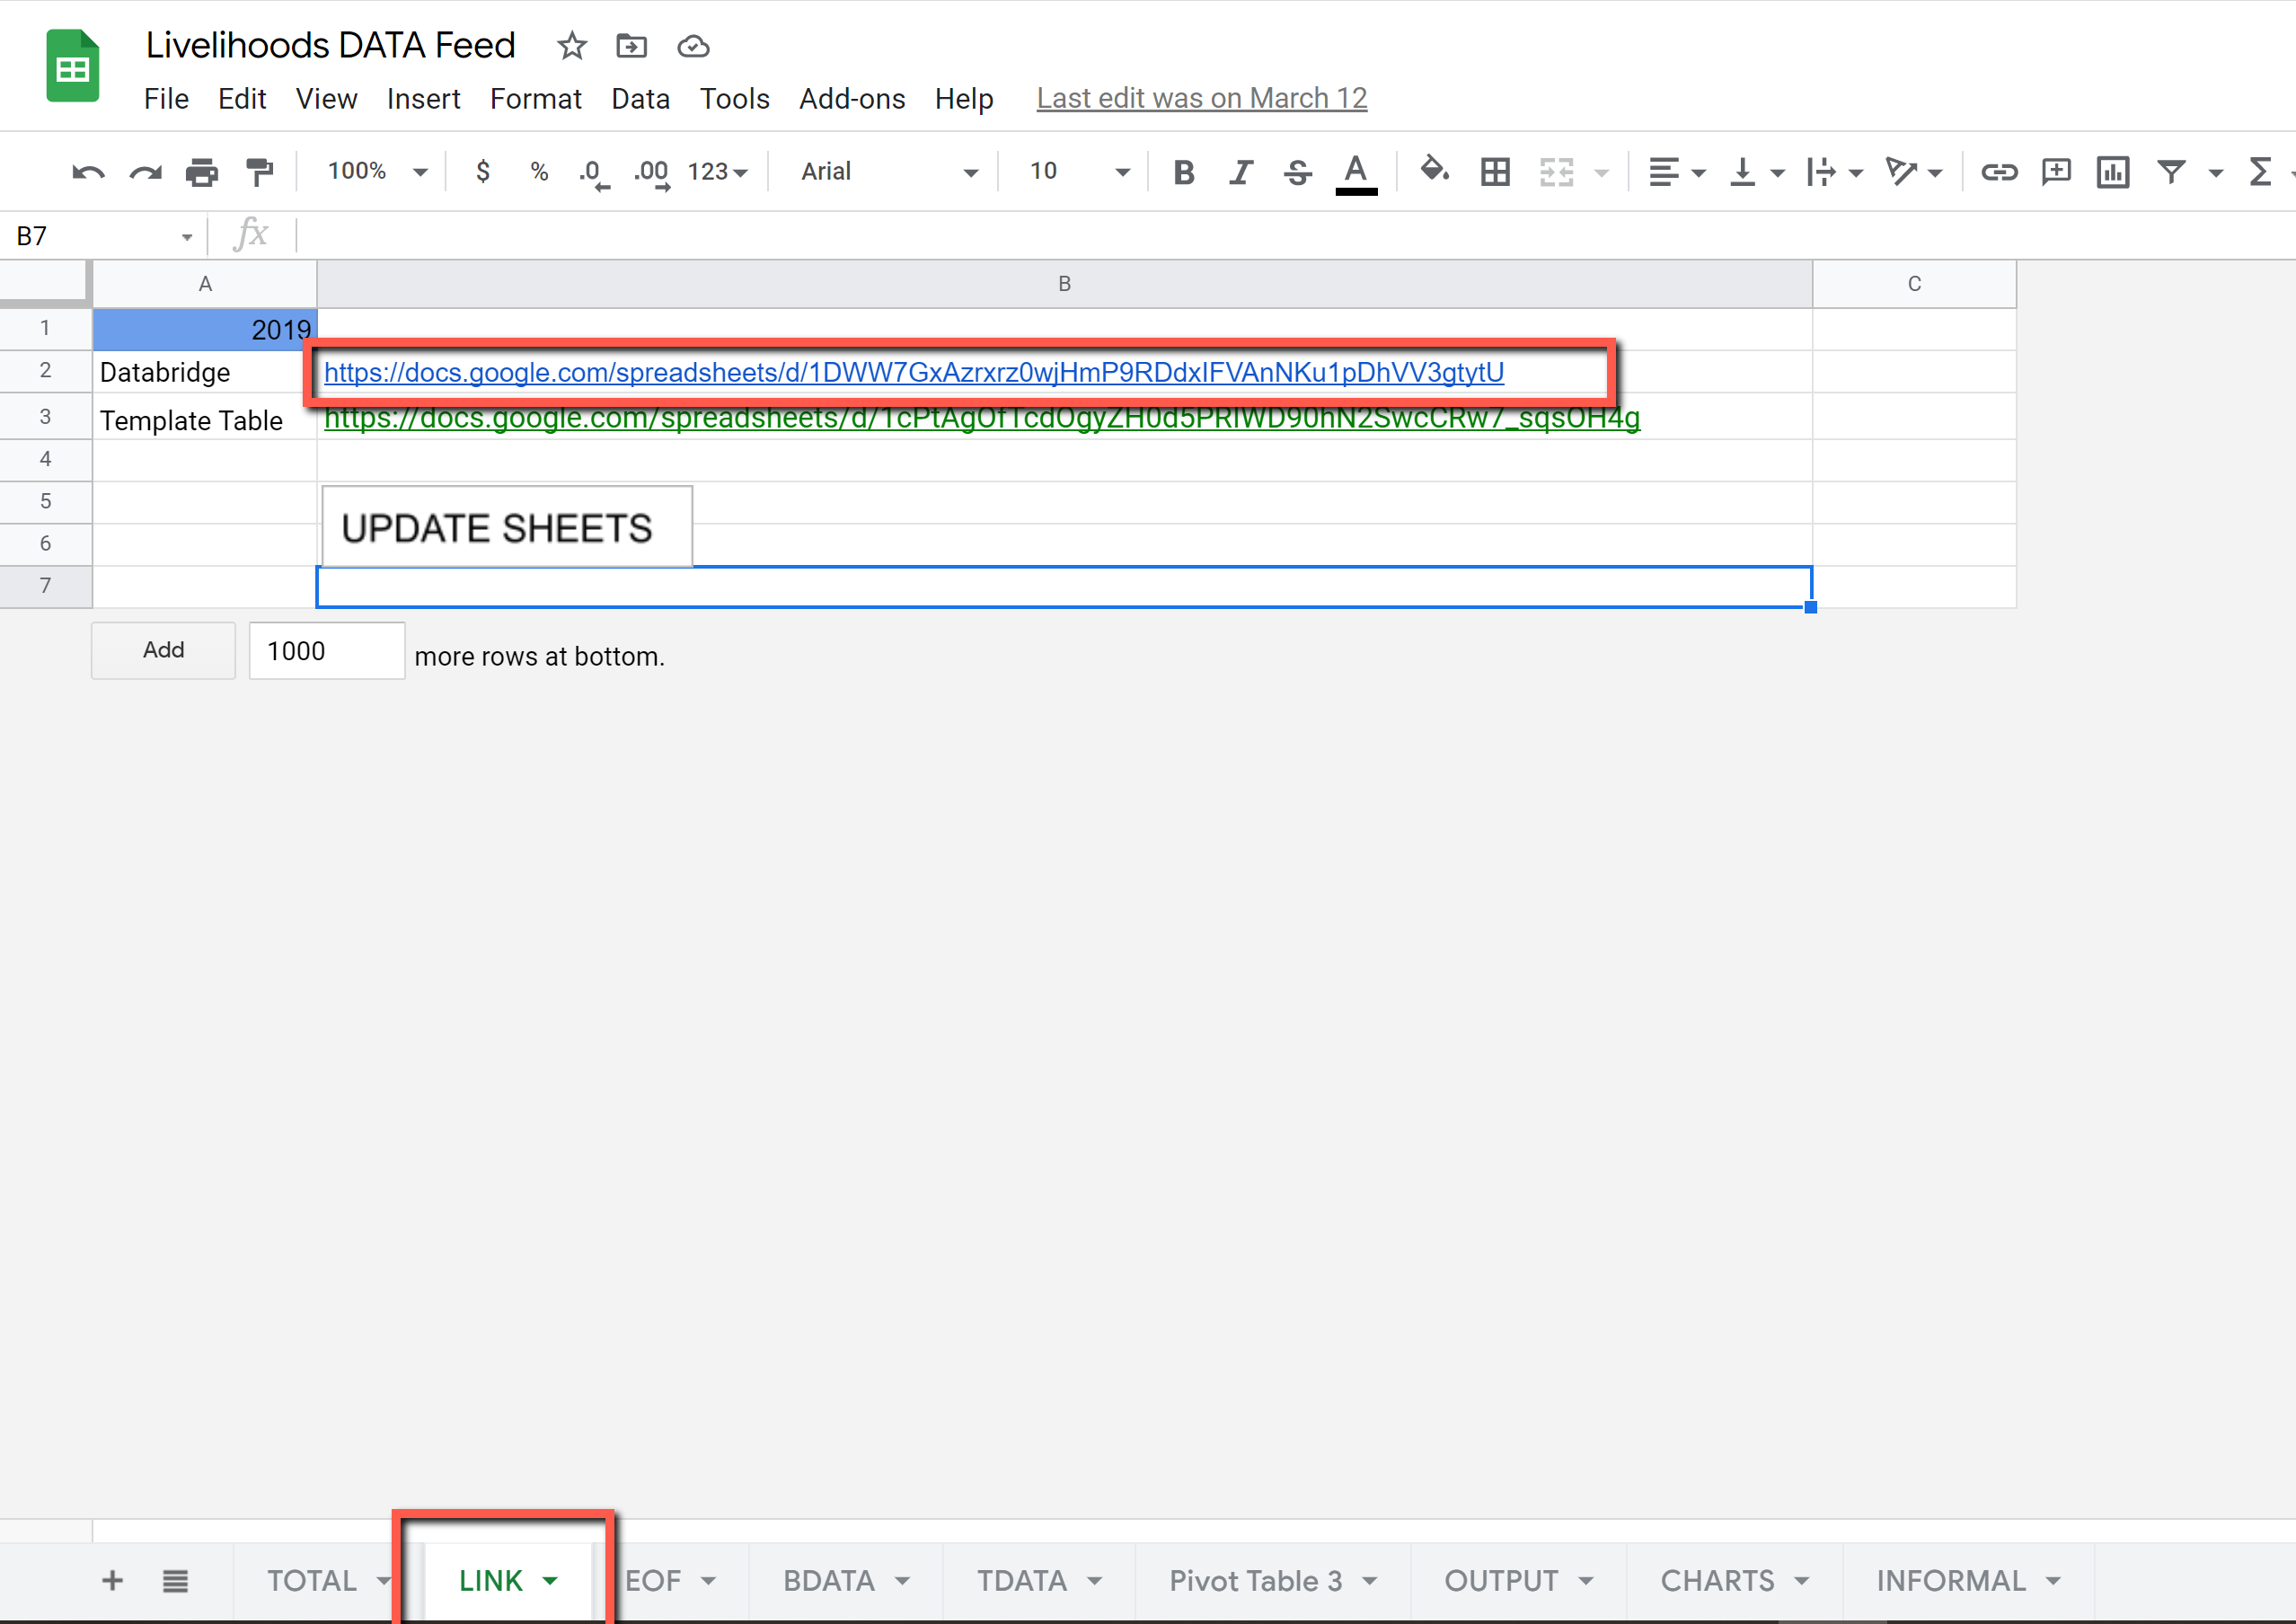
Go to Link tab in data feed file and copy/paste the databridge file for the year you want to used
Warning
Only the countries with baseline and endline data are used to calculate the global indicators.
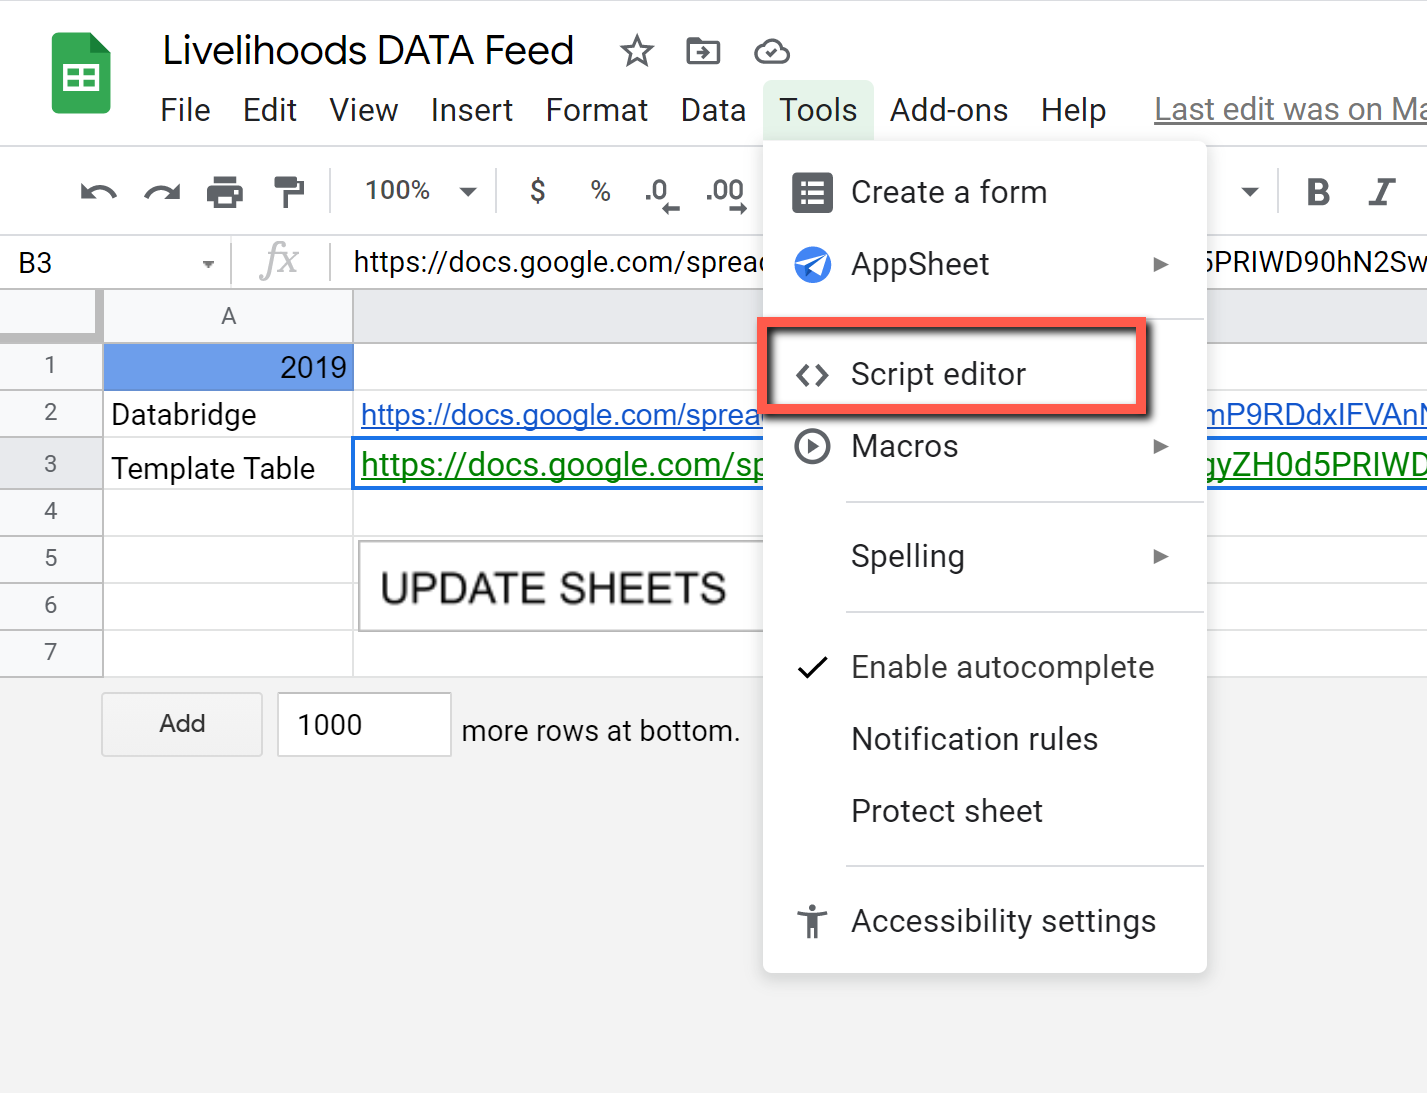
Select Tools from the menu and click on Script Editor to open the Google Apps script.
Go to the NEW.gs file and select LINK function, then run it
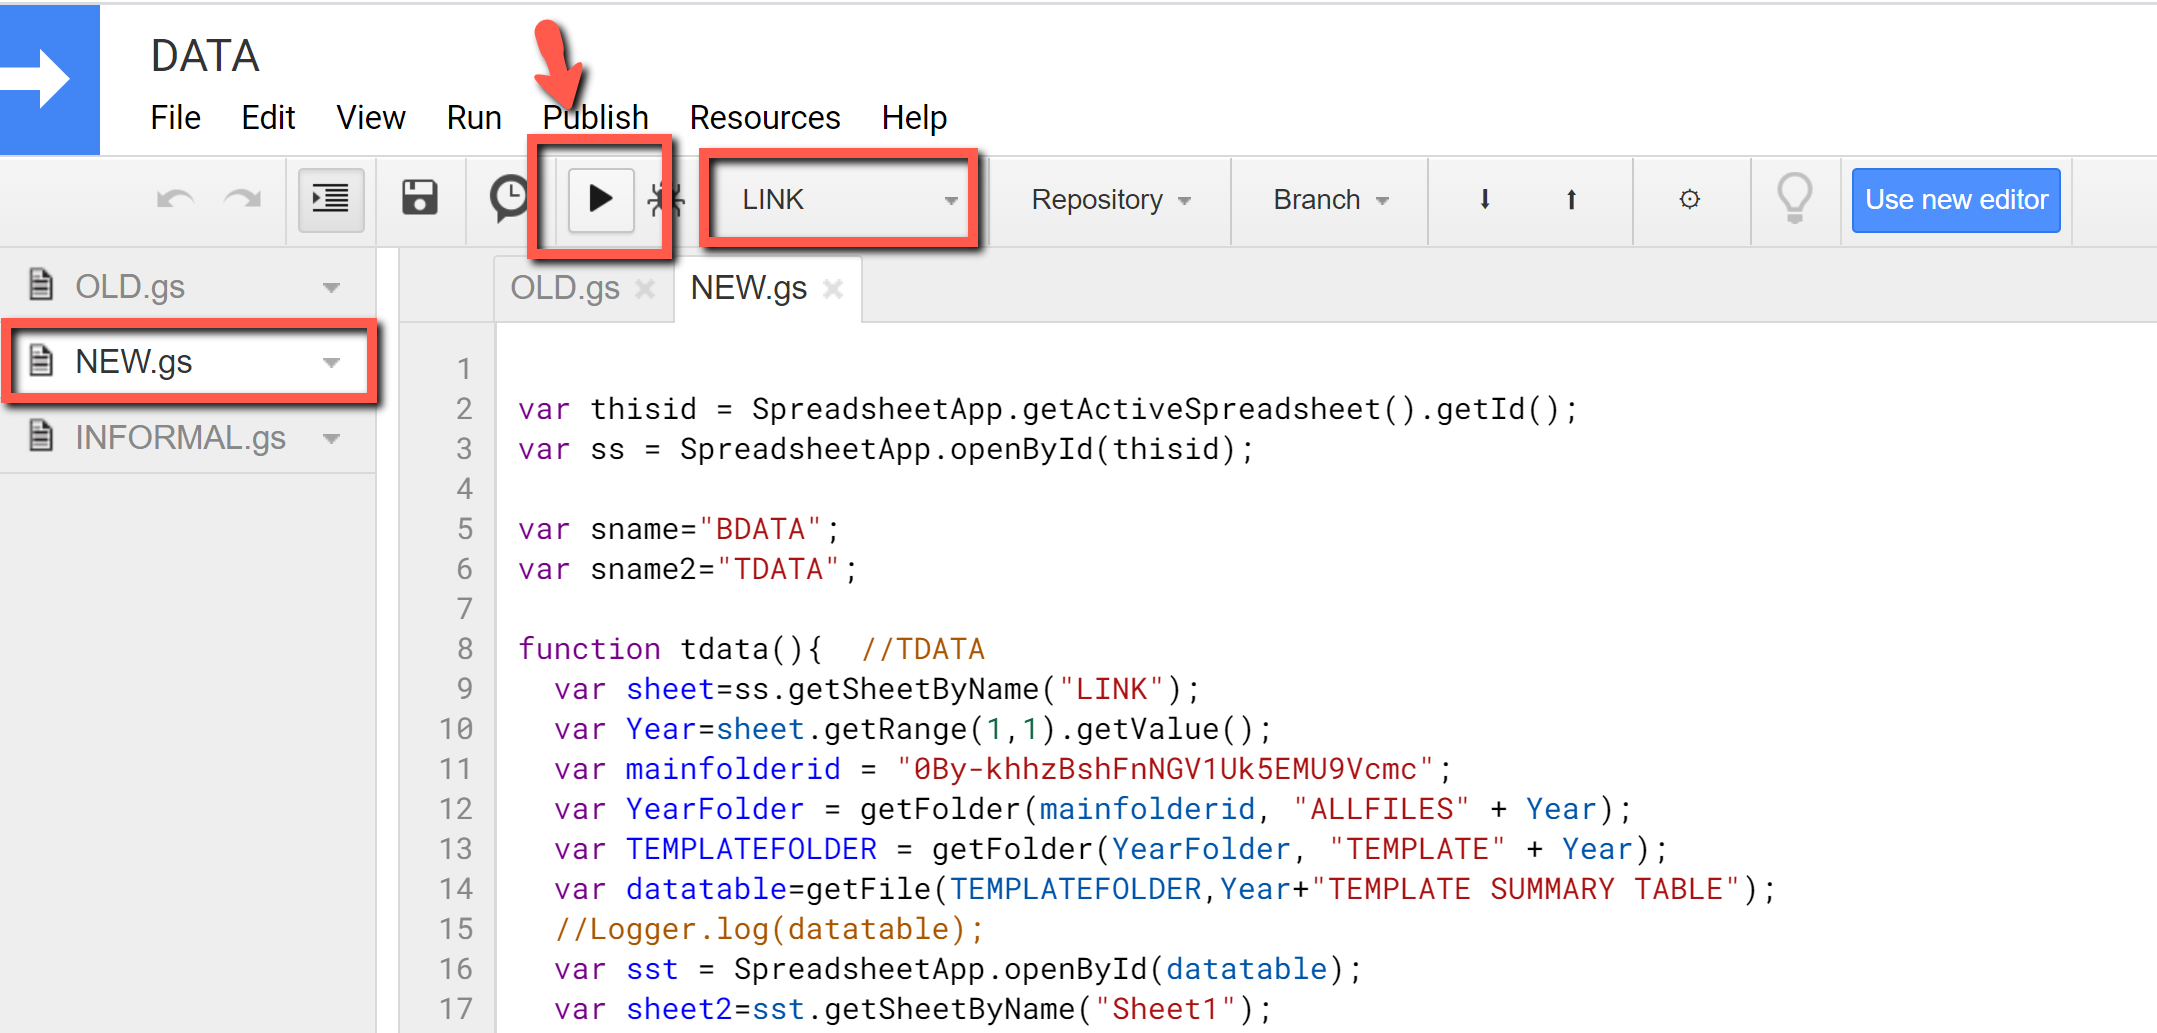
Warning
Running the script could take more than 30 minutes
After the script is finished, the charts in powerPoint need to be updated by clicking on Tools> Linked objects> Update All