Energy Module - Data Cleaning - KPT Day 1 - 2 matching, USD conversion and Top/Bottom coding
Note
Always when a new data are pulled from KoboToolbox to the Analysis sheet, the data is copied to another spreadsheet for data cleaning and KPT panel data matching.
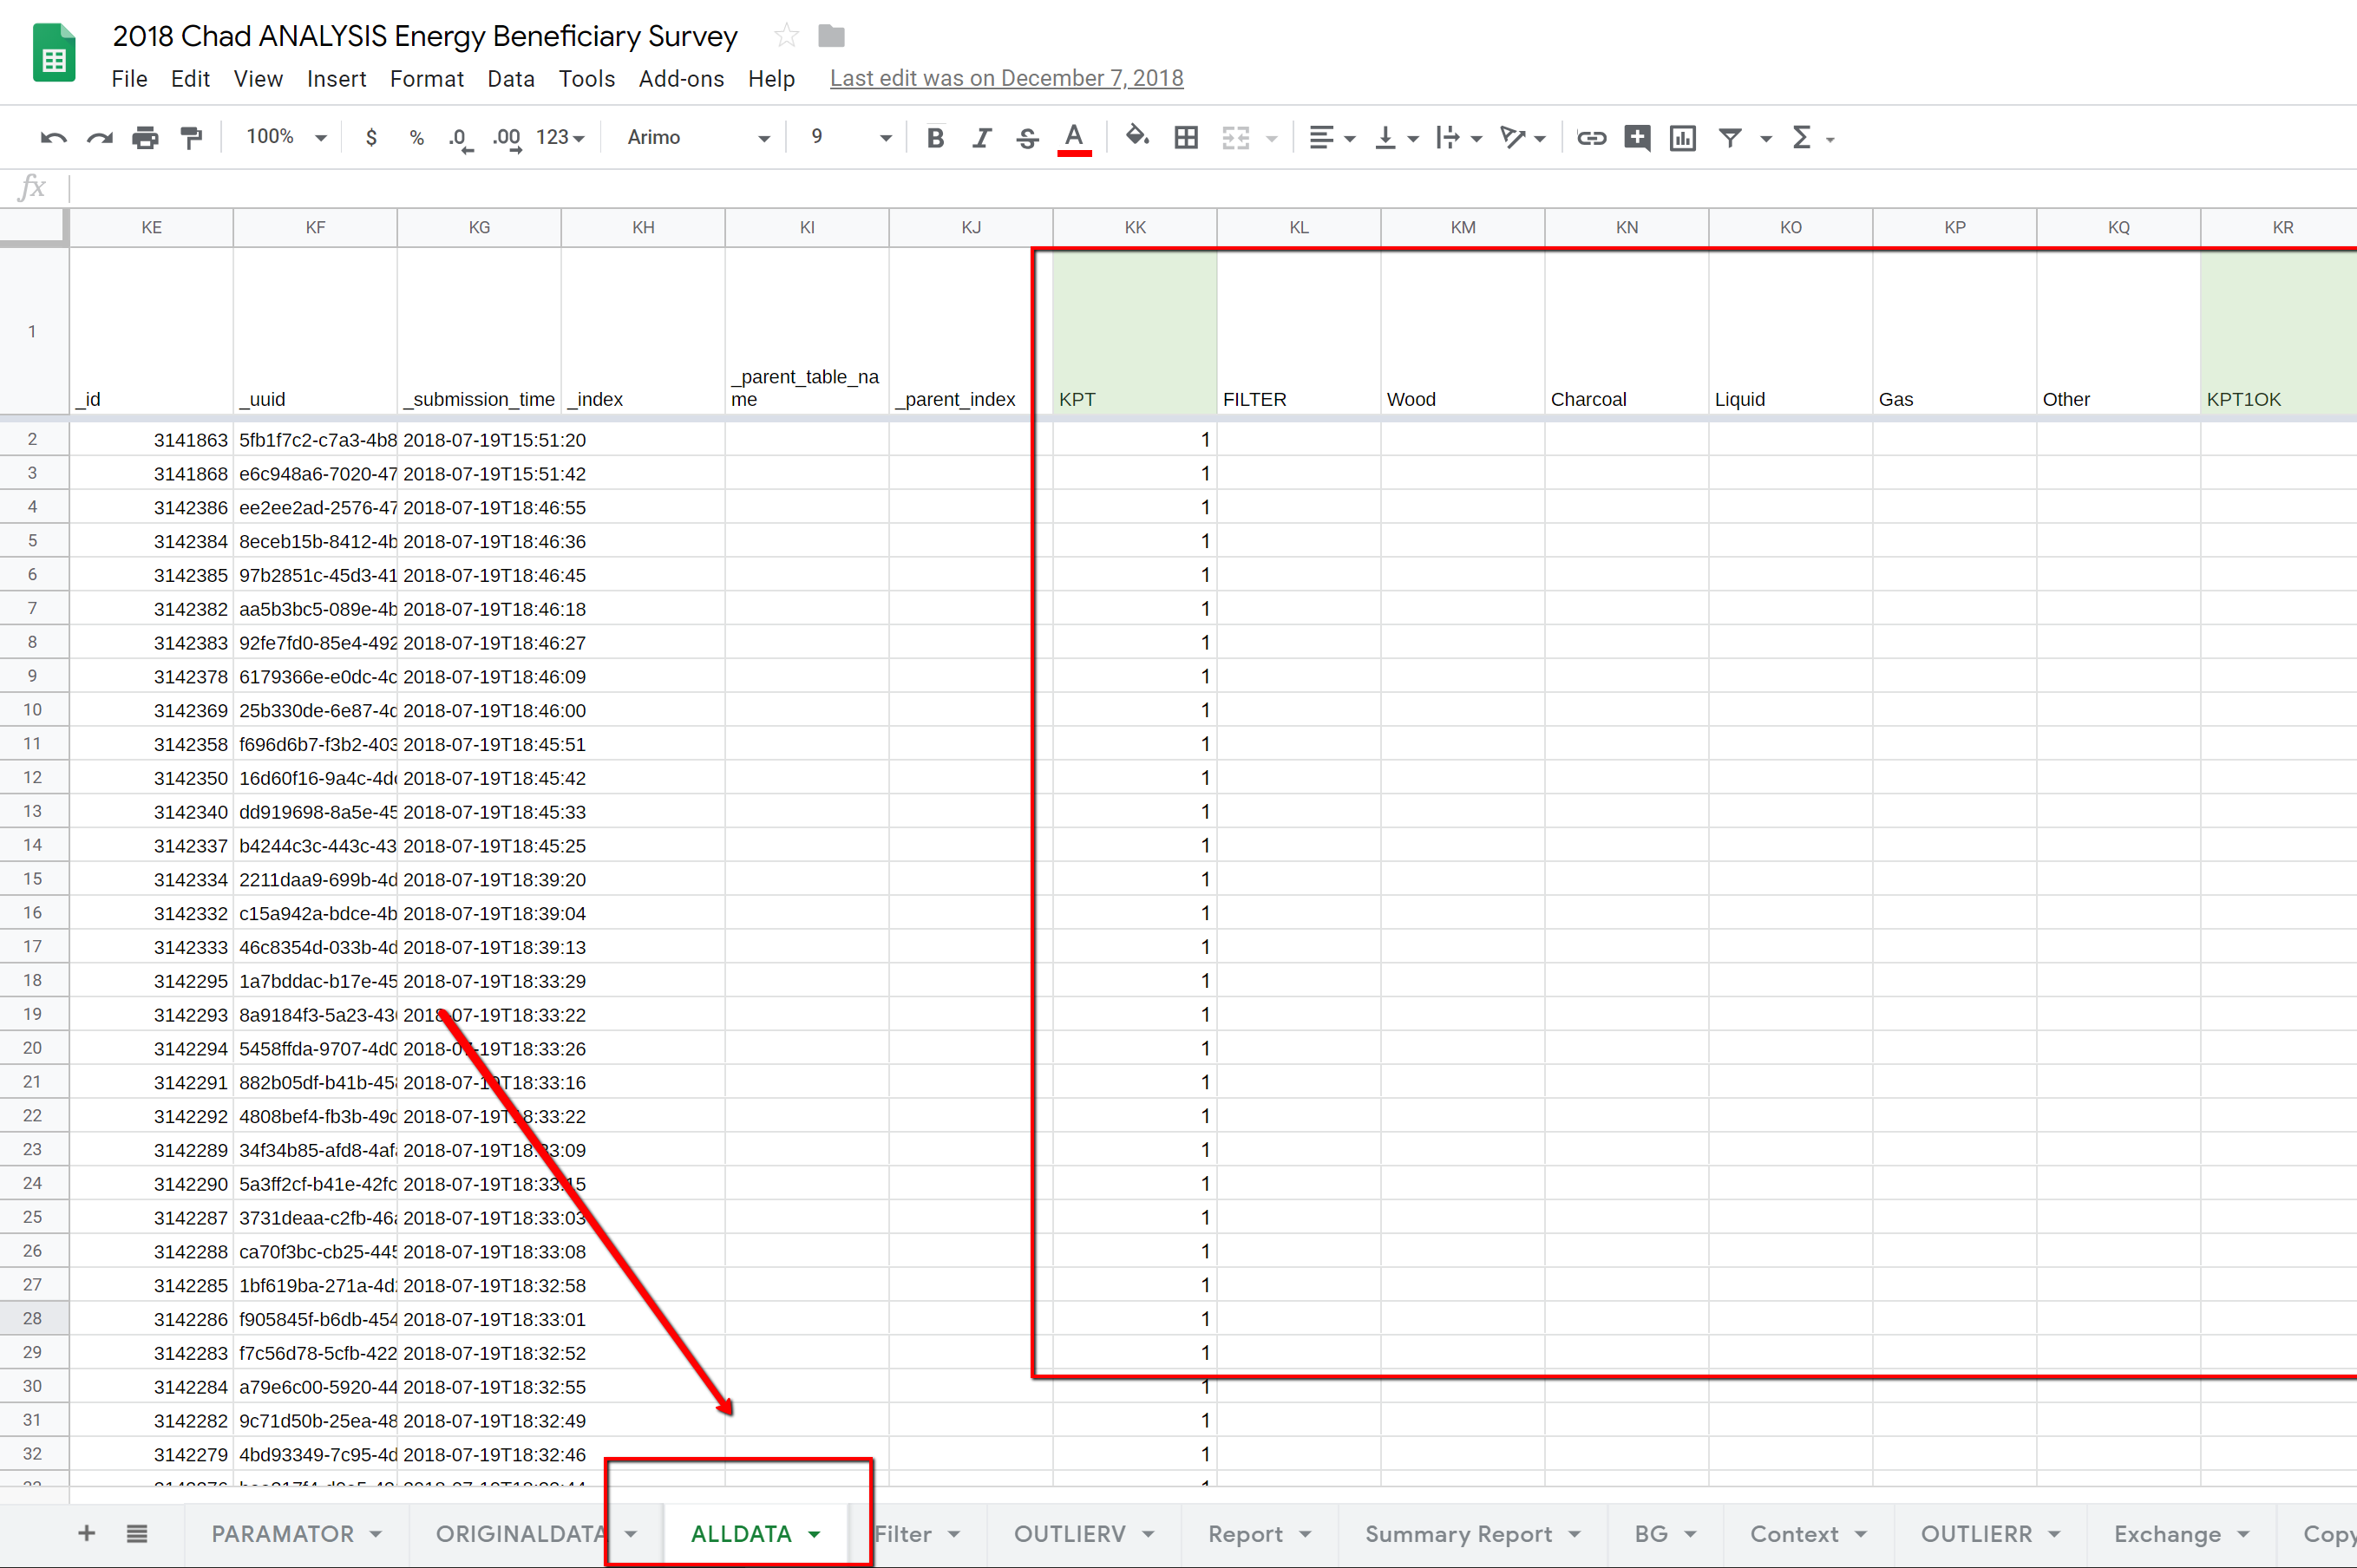
The screenshot of Analysis sheet
Modules of Data Cleaning for Energy Module
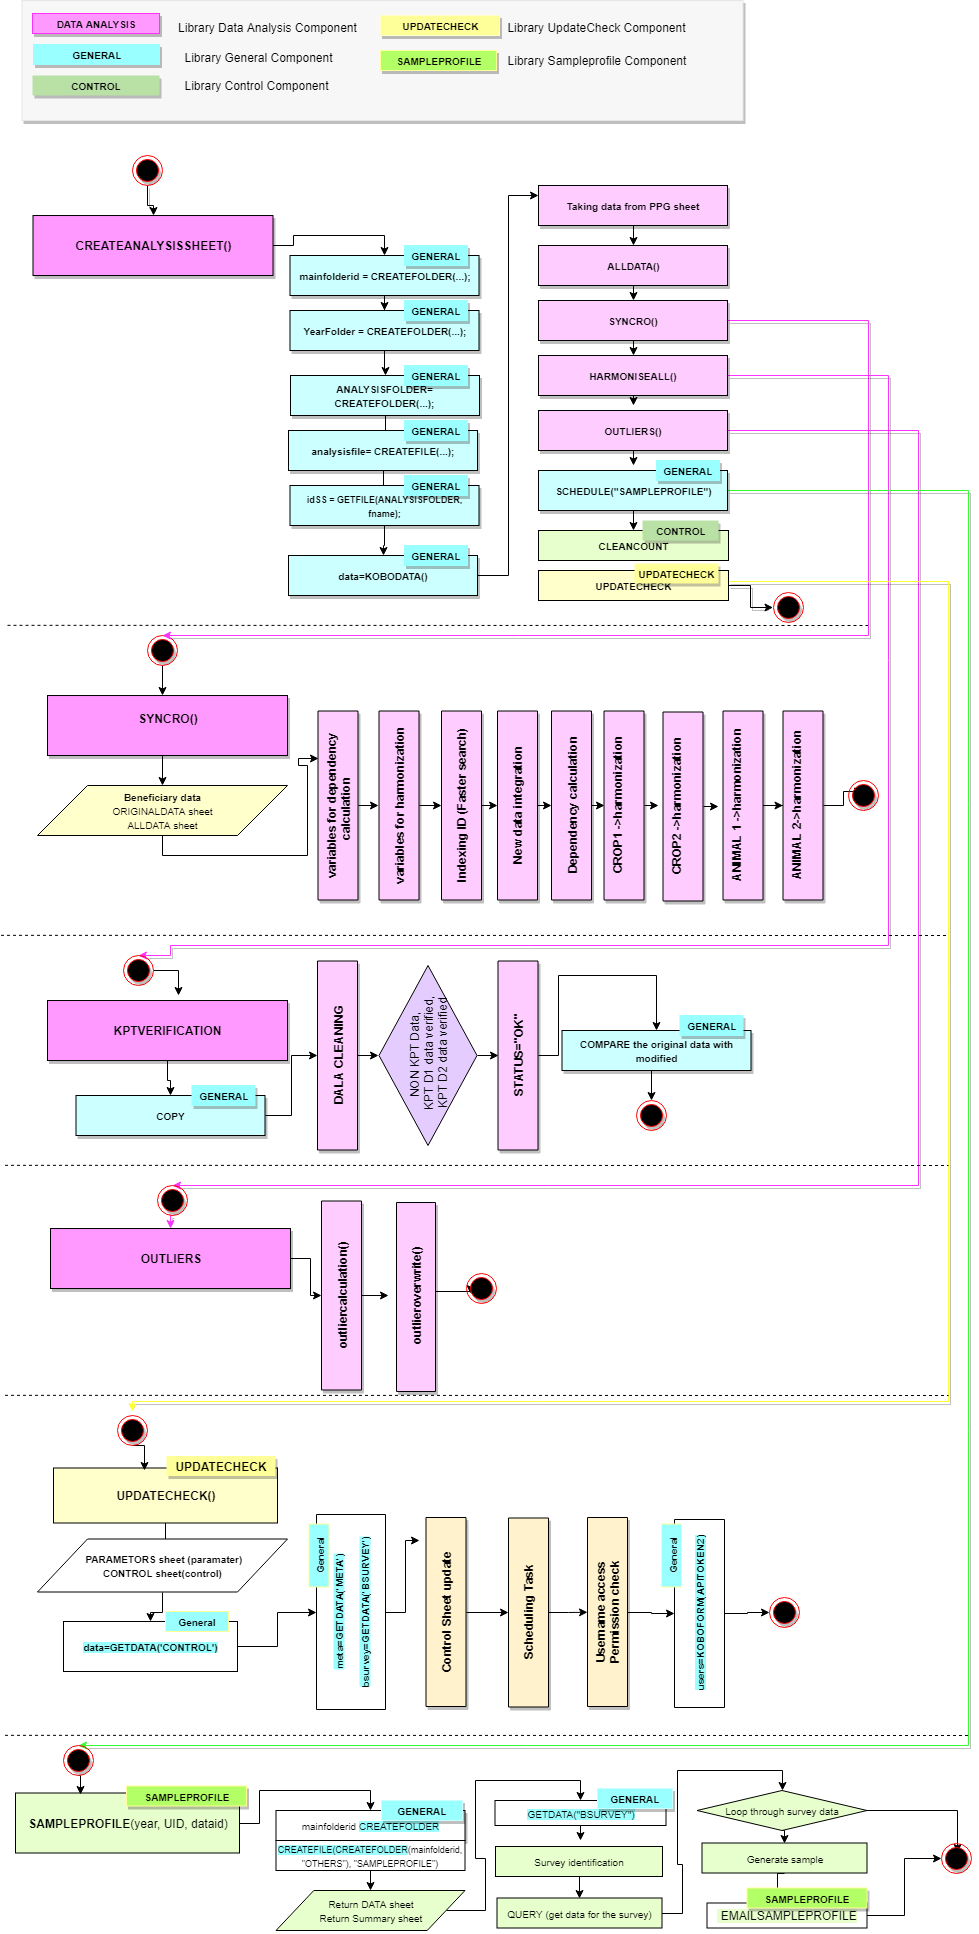
AUTO: After the system pulled the primary data from KoboToolbox to the Analysis sheet, within the createUpdateAnalysisSheet function, it will schedule the tasks in a sequence on the same datasheet to clean/harmonise the primary data.
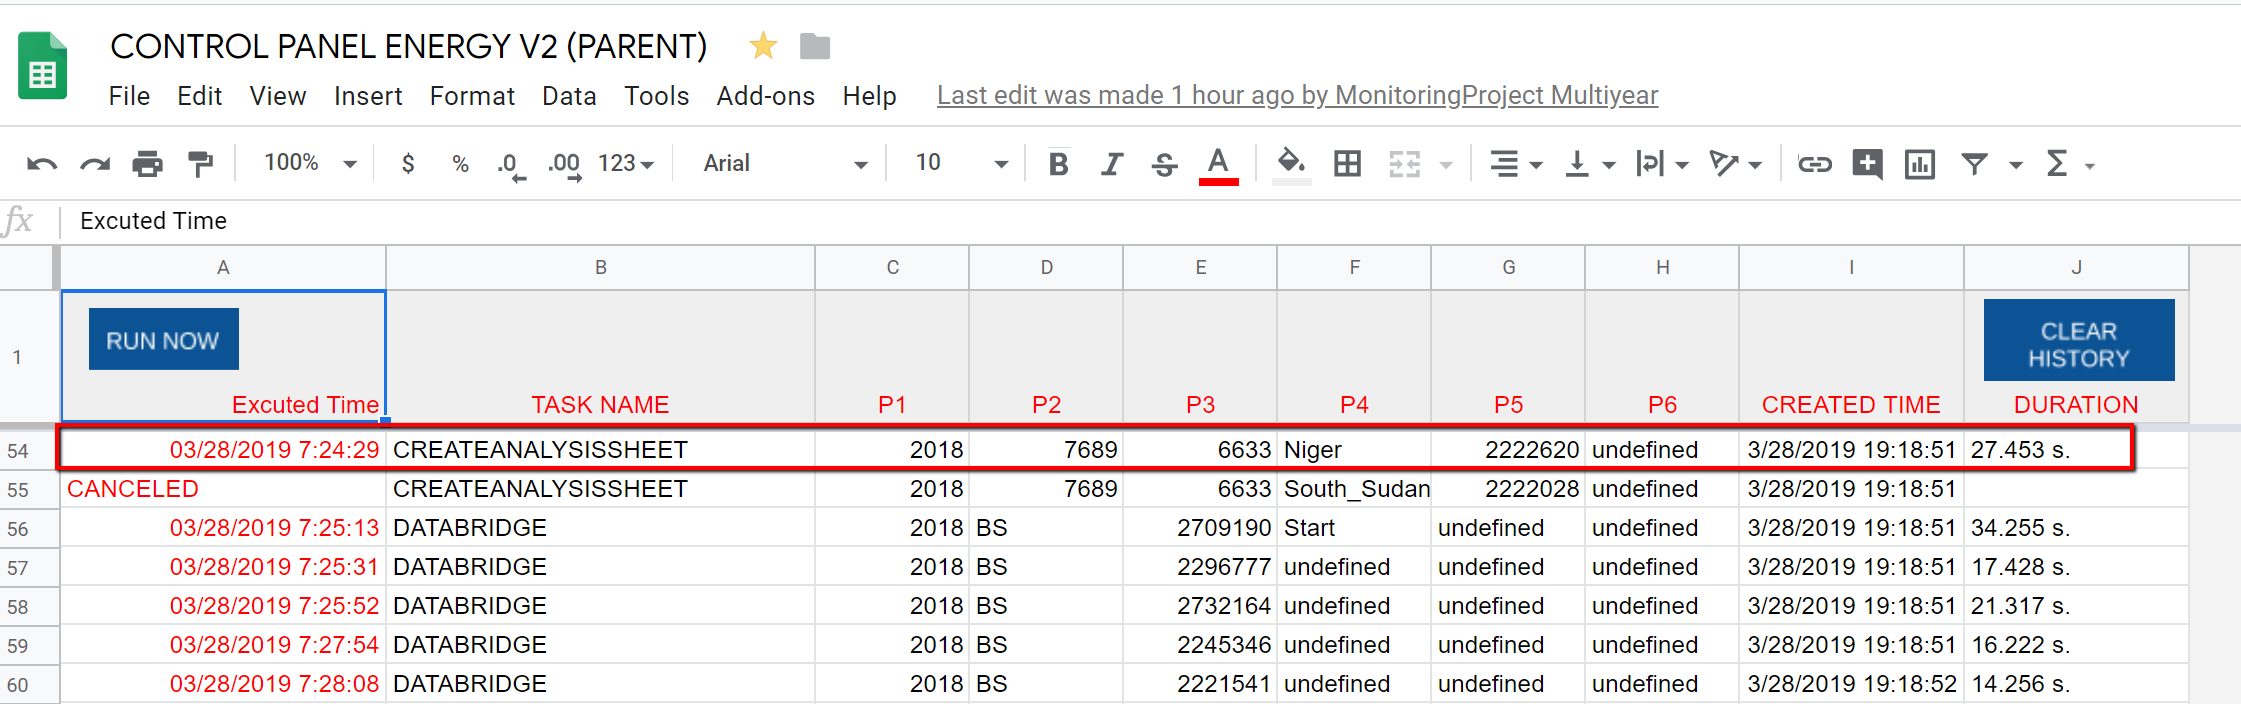
The screenshot of CREATEANALYSISSHEET task
AUTO - STEP1 PULL AND HARMONISE NEW DATA: First task will identify any NEW primary data in the ORIGINALDATA sheet and copy them to the ALLDATA sheet.
AUTO - STEP2 KPT PANEL DATA MATCHING: After the new data were imported and harmonised in the ALLDATA sheet, the system will:
Compare the KTP ID number of Day 1 (O1_KPT_D1/O1_KPT_NO/RANDOMID column) and Day 2 (PARTNER_INFO/KPTD2_ID column). If the number matches, it will register value 1 under the KPT column for both Day 1 and Day 2 data.
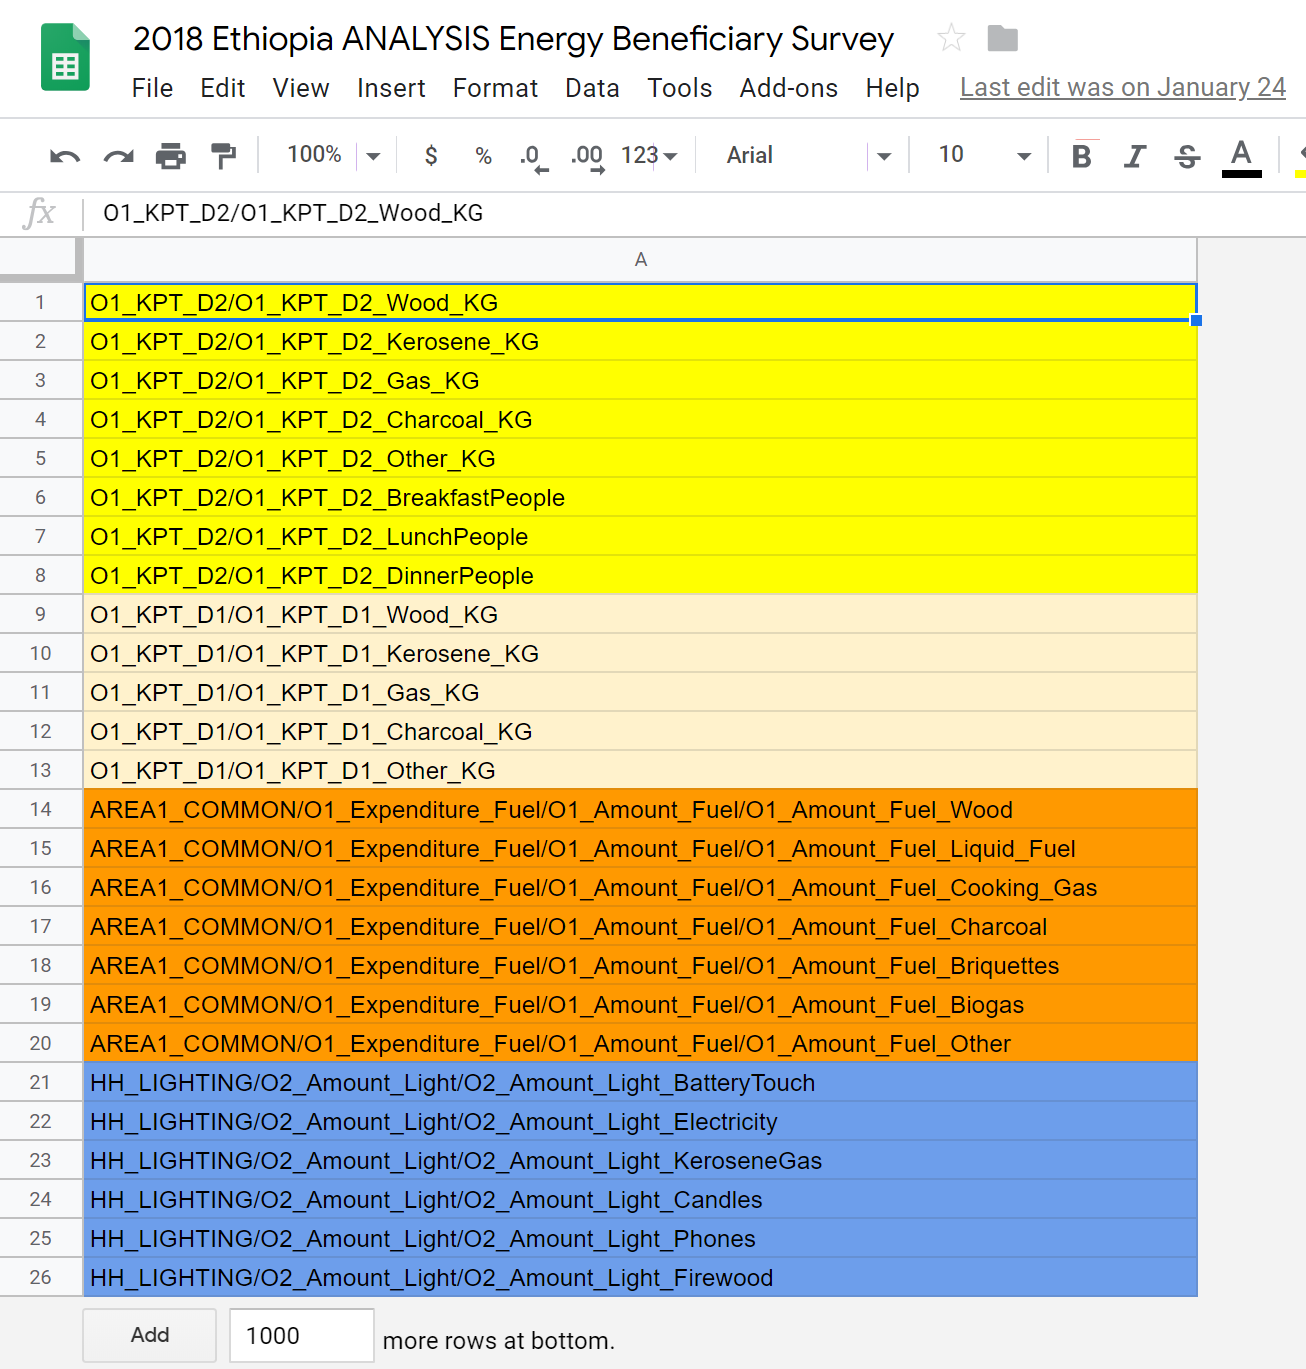
In addition, for the matched KPT dataset, the system will transfer the data related to estimated amount of fuel registered during KPT Day 1 to KPT Day 2 data as the following. In this way, KPT Day 1 and Day 2 data will be in one data.
O1_KPT_D1/O1_KPT_D1_Wood_KG to Wood, O1_KPT_D1/O1_KPT_D1_Charcoal_KG to Charcoal, and so on for Liquid, Gas, and other fuel.
O1_KPT_D1/O1_KPT_D1_Confirmation to KPT1OK column. This indicates if KPT Day 1 went as planned or not.
- It will register the data status under the DATA_CLEANE column as the following
OK: KPT Panel data matched and non-KPT Data which does not require any matching.
OK2: KPT data do not match, but the data contains AREA 2 response on lighting. This data will be excluded from analysis on AREA 1 but included for AREA 2.
Blank : KPT Data which do not match, and the data do not contain AREA 2 response on lighting. This data will be excluded from the analysis and data export.
The columns for KPT for Day 1 and Day 2, and Wood, Charcoal, LIquid, Gas, Other, KPT1OK of KPT Day 2 data will be filled with the corresponding data from KPT Day 1. As such the panel data are created to facilitate the analysis process
The data status will be registered under the DATA_CLEANED column.
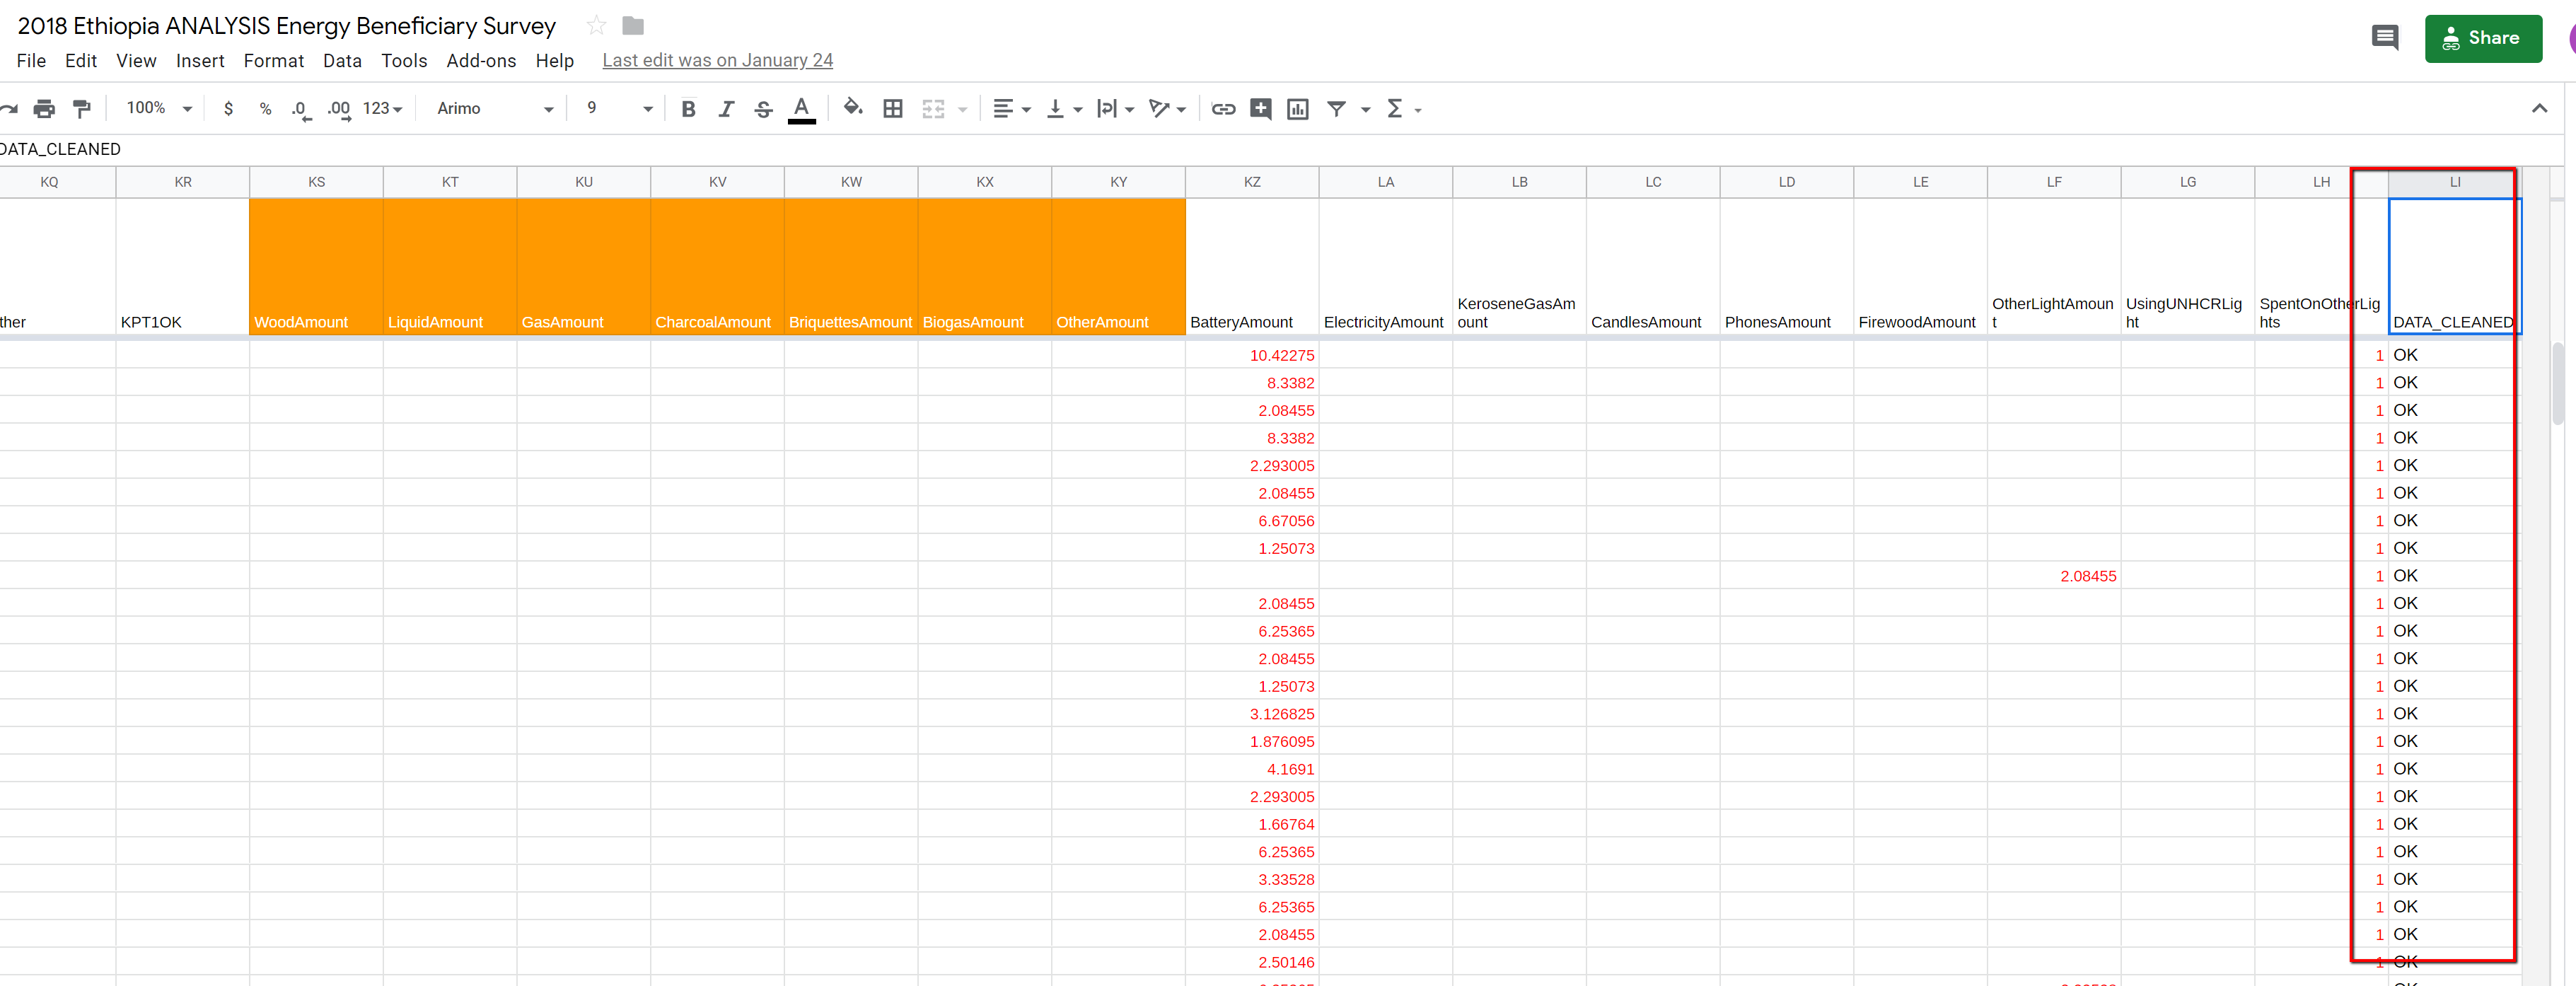
The screenshot of DATA_CLEANED column
AUTO - STEP3 OUTLIERS: KPT Data are verified, the system will calculate Top code 2% and Bottom code 2% for selected variables, in order to control Outliers.
Calculate Top and Bottom 2 % thresholds for each of the variables provided in OUTLIERV sheet, for each country and baseline/endline, using the primary data from ORIGNALDATA sheet.
Based on the calculation above, any values above the Top 2% or below the Bottom 2% will be replaced by the top/bottom 2% values, in the ALLDATA sheet.
Note
This is necessary to recalculate this for the entire data repeatedly, because new data submitted may change the top/bottom 2% thresholds.
The variables to be top/bottom coded are provided in OUTLIERV sheet. In default, 6 variables for the KG/HA of crop production, and # of animals owned are registered.
The screenshot of OUTLIERV sheet
The result of calculation of the 2% top/bottom thresholds will be shown (every time the system recalculates) in OUTLIERR sheet, for each variable, each country, for each of baseline/endline data, under the Bottomcode and Topcode. The system will use these thresholds to review the data in the ALLDATA sheet, and overwrite the values as necessary.
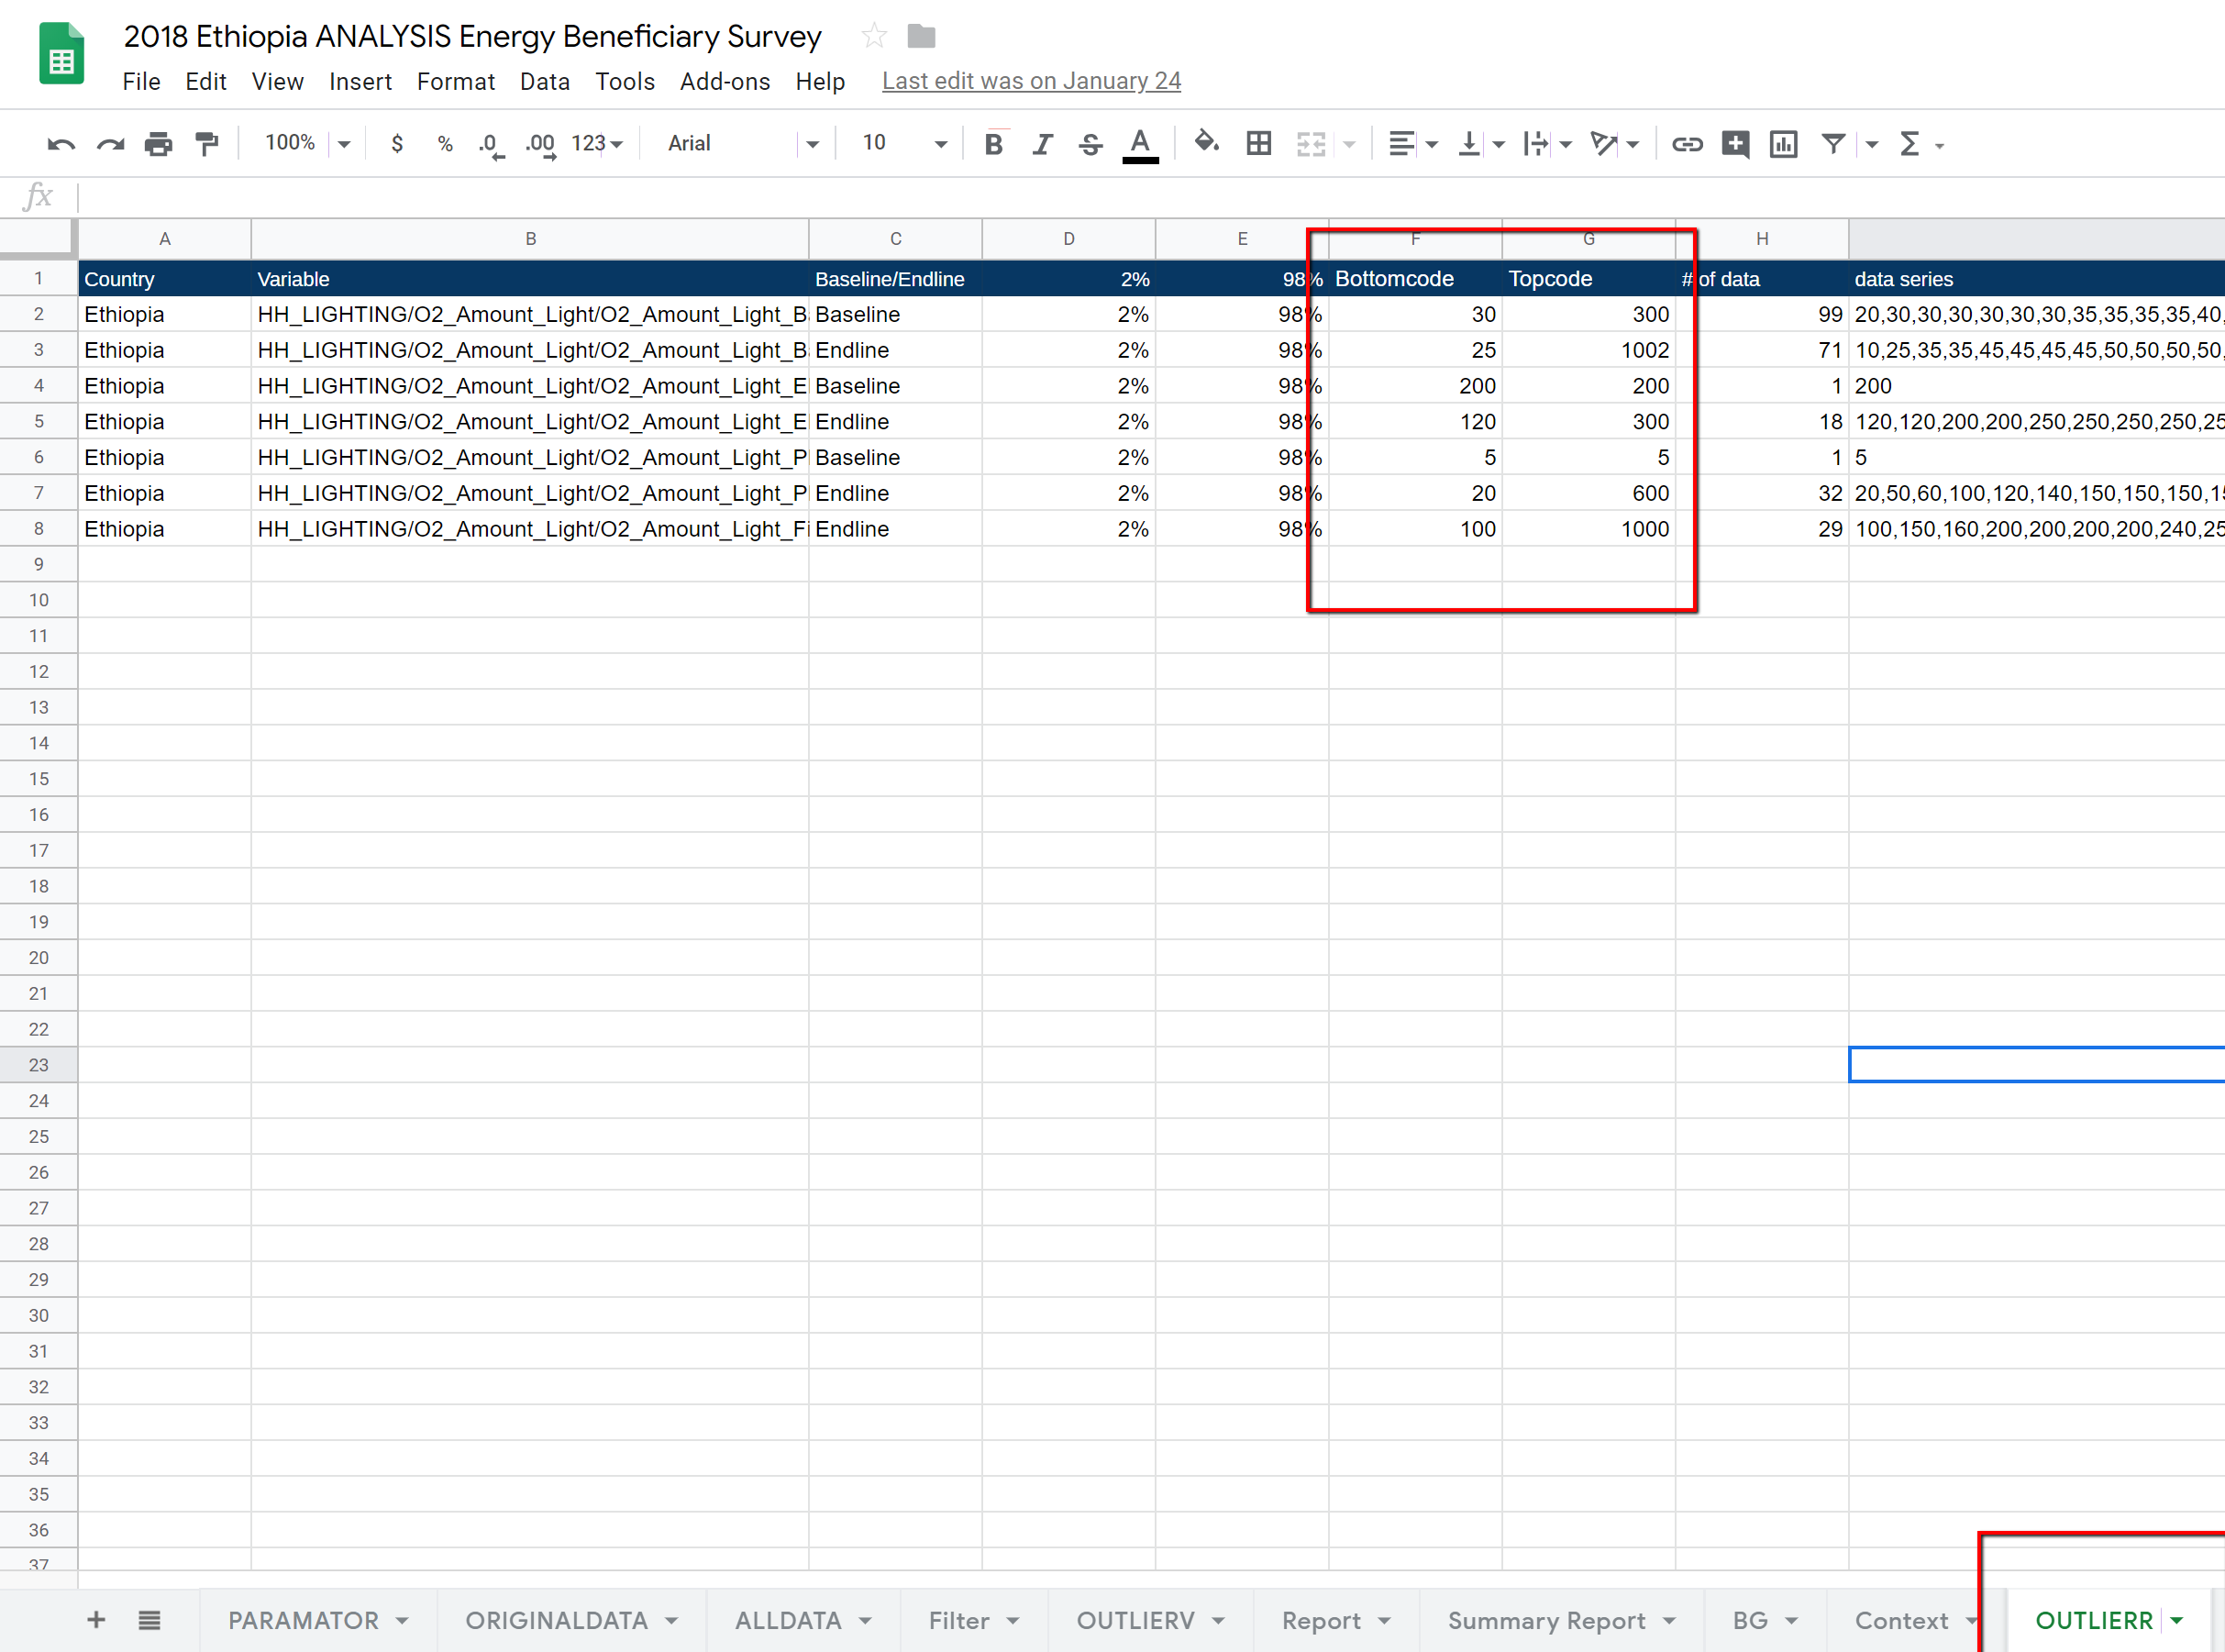
The screenshot of OUTLIERR sheet
AUTO - STEP4 USD CONVERSION ON ENERGY/LIGHT EXPENDITURE: After the outliers are controlled, the expenditure information (spending on fuels and lighting) will be converted into USD.
Look for the exchange rate to be applied for that data. The local currency is obtained from the LocalCurrency column for each data, and the list of exchange rate is provide in the Exchange sheet.
- The exchange rate is applied to calculate the expenditure of fuel and lighting in the following columns.
Fuel: ‘AREA1_COMMON/O1_Expenditure_Fuel/O1_Amount_Fuel/O1_Amount_Fuel_Wood’ to Wood, ‘AREA1_COMMON/O1_Expenditure_Fuel/O1_Amount_Fuel/O1_Amount_Fuel_Liquid_Fuel’ to Liquid, and so on for all the fuel types.
Lighting: ‘HH_LIGHTING/O2_Amount_Light/O2_Amount_Light_BatteryTouch’ to BatteryAmount, and ‘HH_LIGHTING/O2_Amount_Light/O2_Amount_Light_Electricity’ to Electricity and so on for all the lighting types.
The exchange rate is provided in the Exchange sheet where the column A is the name of local currency (to be matched with the data under column LocalCurrency), and the rate to be applied is under the column C.
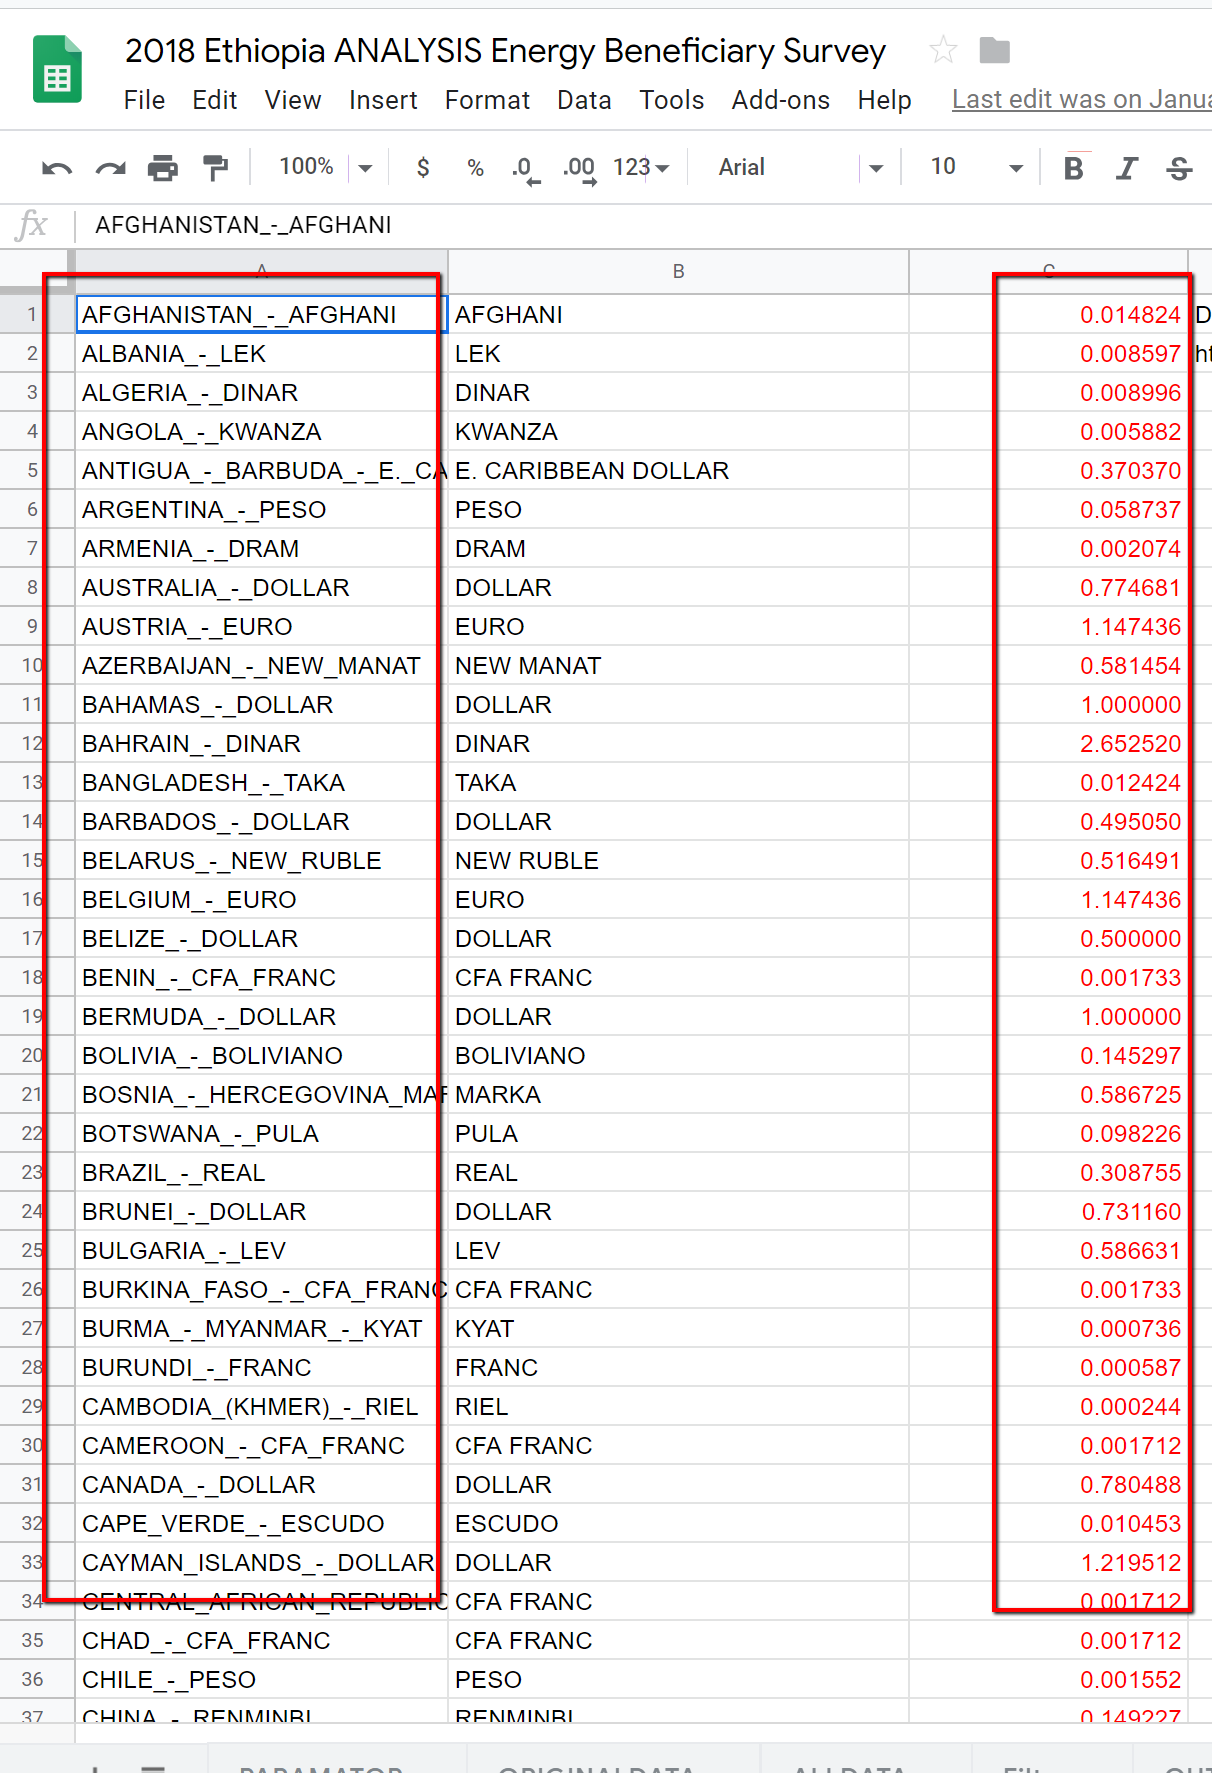
The screenshot of EXCHANGE sheet
Note
The exchange rate should be updated every year, using the data from US Tresurey : https://www.fiscal.treasury.gov/fsreports/rpt/treasRptRateExch/historicalRates.htm
The converted expenditures in USD are registered under the following columns.
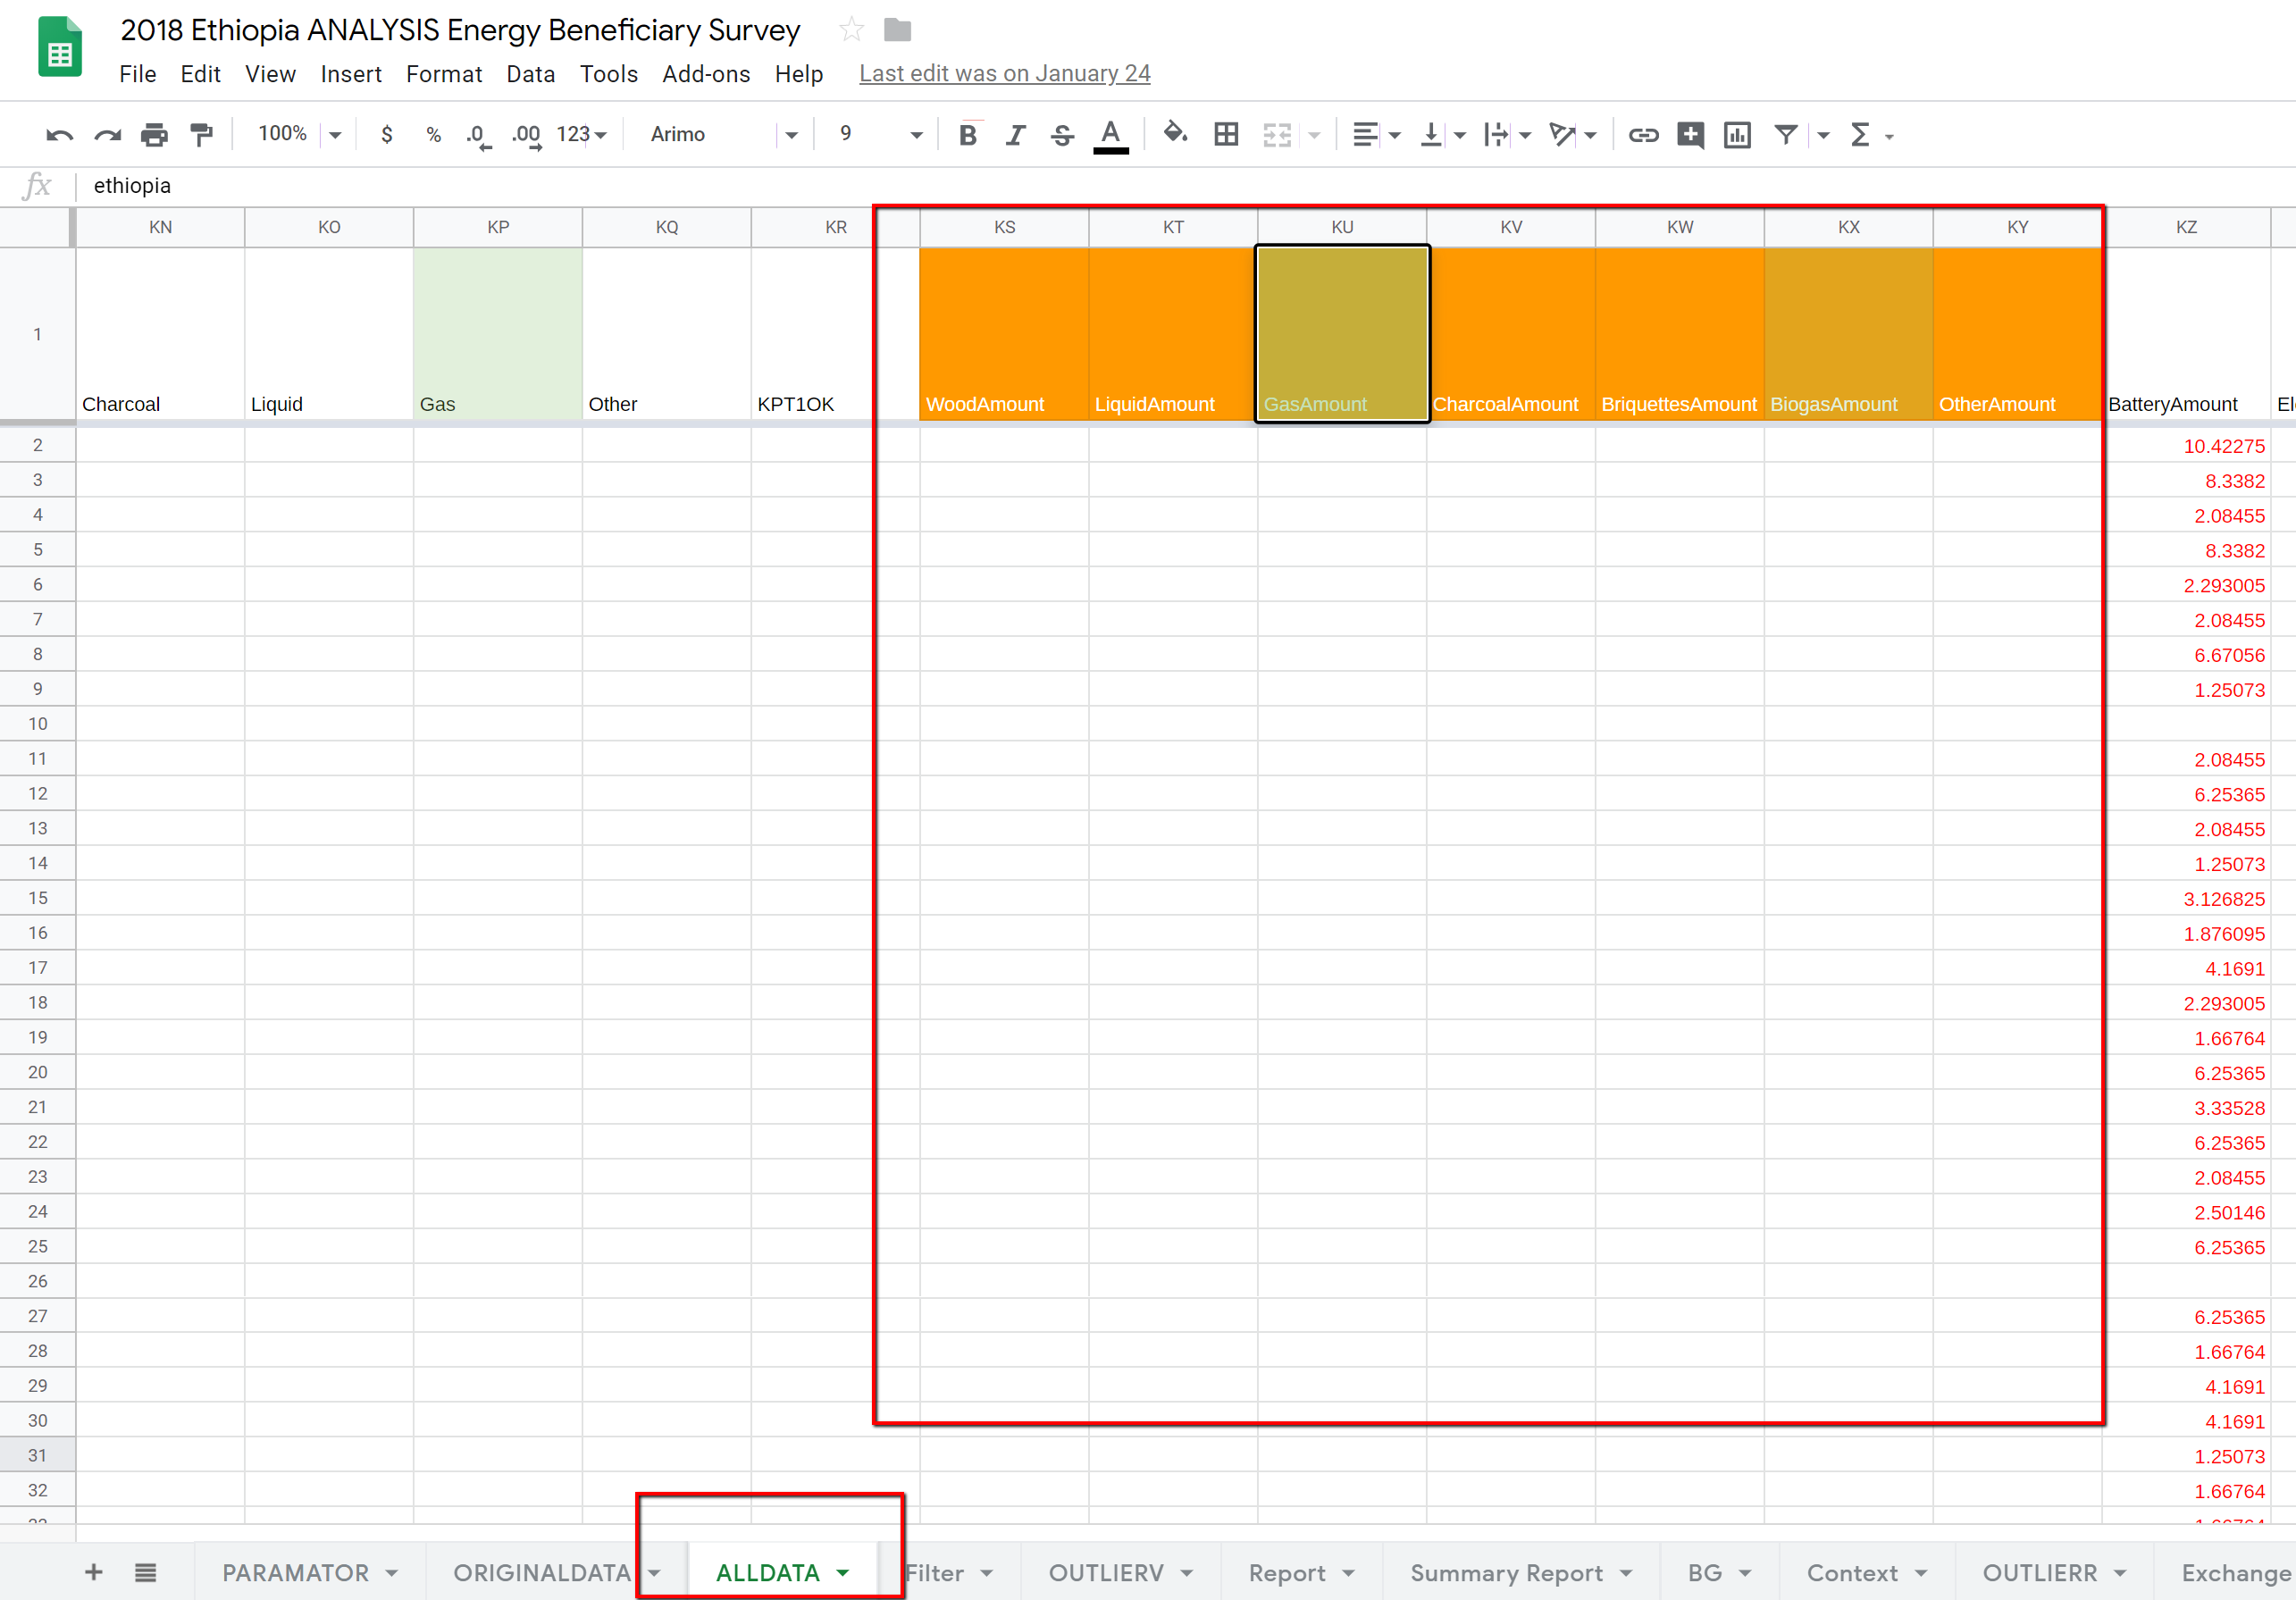
The screenshot of ALLDATA sheet
When the datasheet is updated, the % of the data cleaning progress will be updated under the CLEANED DATA % column. It may not reach 100% as not all KPT data may not match.
GAS Functions for Data Cleaning of Energy Module
syncroEnergyHarmonization()
DATAANALYSIS component verifyKPTEnergy()
DATAANALYSIS component recalculateTopBottomThresholds()
DATAANALYSIS component outlieroverwrite()