DATA ANALYSIS Component
Function updateAllDataKobo
-
updateAllDataKobo()¶ The function schedule severals tasks to run the comprehensive update of data from Kobotoolbox
1 2 3 4 5 6 | function updateAllDataKobo() {
var r = Browser.msgBox("Warning: This will schedule severals tasks to run the comprehensive update of data from Kobotoolbox, after which the data will be harmonised and exported to the databridge. This will take up to 60 minutes, and can only be scheduled for gradual excusion. After scheduling, it is necessary to activate the auto task option. Are you sure to proceed?", Browser.Buttons.YES_NO);
if (r == "no") { return; }
updateDataHarmonizeDatabridge();
//ANALYSISDATAALL();
}
|
Function updateDataHarmonizeDatabridge
-
updateDataHarmonizeDatabridge(pkey)¶ The function schedules the severals tasks to run the comprehensive update of data from Kobotoolbox, after which the data will be harmonised and exported to the databridge. This will take up to 60 minutes, and can only be scheduled for gradual excusion. After scheduling, it is necessary to activate the auto task option
- Arguments
pkey (Object) – the list of key properties and their values
- Returns
keyinputs – list of key parameters.
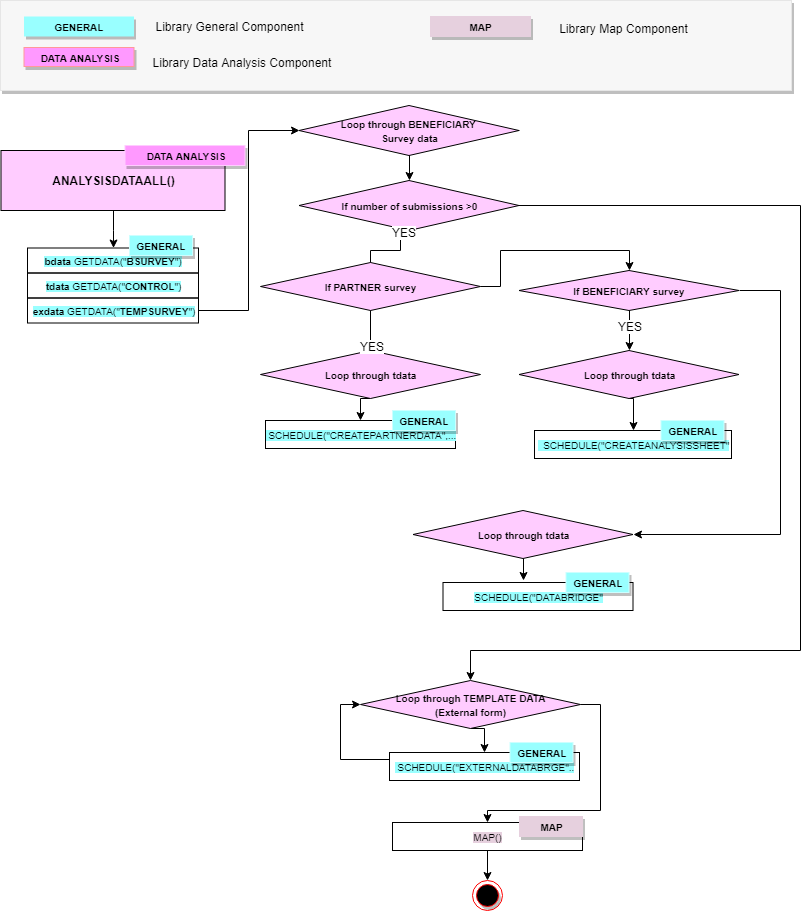
The block diagram of updateDataHarmonizeDatabridge function
1 2 3 4 5 6 7 8 9 10 11 | function updateDataHarmonizeDatabridge(pkey) {
key = pkey;
/*bdata {array} - data from the BSURVEY sheet*/
var bdata = getData("BSURVEY");
/*tdata {array} - data from the Control sheet*/
var tdata = getData("CONTROL");
/*data {array} - data from the TEMPSURVEY sheet*/
var exdata = getData("TEMPSURVEY");
var fyear;
var tempid;
|
Loop through BSurvey data, If partner survey schedules CREATEPARTNERDATA task

Example of CREATEPARTNERDATA task
1 2 3 4 5 6 7 8 9 10 11 12 13 14 15 16 17 18 19 | for (i = 0; i < bdata.length; i++) {
for (y = 2017; y < 2030; y++) {
/*If number submission for this year > 0 */
if (bdata[i][bdata[0].indexOf("YEAR")] == y && bdata[i][bdata[0].indexOf("num_of_submissions")] >= 0) {
fyear = y;
/*if Partner Survey*/
if (bdata[i][bdata[0].indexOf("title")].indexOf("Partner") > -1) {
for (it = 0; it < tdata.length; it++) {
if (tdata[it][tdata[0].indexOf("PROGRAMME_SYNOPSIS/PROGRAMME_INFORMATION/Year")] == fyear) {
/*tempid {number} - index of formid in data [CONTROL sheet] */
tempid = tdata[it][tdata[0].indexOf("formid")];
/*Function schedules the CREATEPARTNERDATA task with parameter P1 - year; P2 -formid from Survey (PARAMETOR sheet); P3 - formid from Control Panel (Control Sheet)*/
SCHEDULE("CREATEPARTNERDATA", fyear, bdata[i][bdata[0].indexOf("formid")], tempid);
break;
}
}
}
|
Loop through BSurvey data, If partner survey schedules CREATEANALYSISSHEET task

Example of CREATEANALYSISSHEET task
1 2 3 4 5 6 7 8 9 10 11 12 13 14 15 16 17 18 19 20 21 22 | if (bdata[i][bdata[0].indexOf("title")].indexOf("DEMO") == -1 && bdata[i][bdata[0].indexOf("title")].indexOf("Partner") == -1) {
var country = [];
/*CREATEANALYSISSHEET FOR EACH TEMPLATE FOR ALL - REPEAT CREATANALYSISSHEET FOR ALL COUNTRIES */
for (ii = 0; ii < tdata.length; ii++) {
if (tdata[ii][tdata[0].indexOf("PROGRAMME_SYNOPSIS/PROGRAMME_INFORMATION/Year")] != fyear) { continue; }
if (tdata[ii][tdata[0].indexOf("Baseline")] == "" && tdata[ii][tdata[0].indexOf("Endline")] == "" && tdata[ii][tdata[0].indexOf("Midline")] == "") { continue; }
if (country.indexOf(tdata[ii][tdata[0].indexOf("CONTACT_INFORMATION/Country")]) > -1) { continue; } else { country.push(tdata[ii][tdata[0].indexOf("CONTACT_INFORMATION/Country")]); }
var fcountry = tdata[ii][tdata[0].indexOf("CONTACT_INFORMATION/Country")];
var tempid = tdata[ii][tdata[0].indexOf("formid")];
/*Function schedules the CREATANALYSISSHEET task with parameter P1 - year; P2 -formid from Survey (PARAMETOR sheet); P3 - formid from Control Panel (Control Sheet); P4 - country, P5 - dataid from Control SHeet */
SCHEDULE("CREATEANALYSISSHEET", fyear, bdata[i][bdata[0].indexOf("formid")], tempid, fcountry, tdata[ii][tdata[0].indexOf("_id")]);
}
|
Loop through BSurvey data, schedules DATABRIDGE task

Example of DATABRIDGE task
1 2 3 4 5 6 7 8 9 10 11 12 13 14 15 16 17 18 19 20 21 22 23 24 25 26 27 28 | var country = [];
/*repeat for databridge */
var dbcount = 0;
for (ii = 0; ii < tdata.length; ii++) {
if (tdata[ii][tdata[0].indexOf("PROGRAMME_SYNOPSIS/PROGRAMME_INFORMATION/Year")] != fyear) { continue; }
if (String(tdata[ii][tdata[0].indexOf("Cleaning")]) == "") { continue; }
if (country.indexOf(tdata[ii][tdata[0].indexOf("CONTACT_INFORMATION/Country")]) > -1) { continue; } else { country.push(tdata[ii][tdata[0].indexOf("CONTACT_INFORMATION/Country")]); }
var fcountry = tdata[ii][tdata[0].indexOf("CONTACT_INFORMATION/Country")];
var tempid = tdata[ii][tdata[0].indexOf("formid")];
if (dbcount == 0) {
/*Function schedules the CREATANALYSISSHEET task with parameter P1 - year; P2 -'PS'; P3 - dataid from Control Panel (Control Sheet); P4 - 'Start' */
SCHEDULE("DATABRIDGE", fyear, "BS", tdata[ii][tdata[0].indexOf("_id")], "Start");
} else
SCHEDULE("DATABRIDGE", fyear, "BS", tdata[ii][tdata[0].indexOf("_id")]);
dbcount++;
}
break;
}
}
}
}
|
Loop through BSurvey data, schedules EXTERNALDATABRIDGE task

Example of EXTERNALDATABRIDGE task
1 2 3 4 5 6 7 8 9 10 11 12 13 14 15 16 17 18 19 20 21 22 23 24 25 26 | /*Template*/
for (ix = 1; ix < exdata.length; ix++) {
/*If Exterdan Data Register Form*/
if (exdata[ix][exdata[0].indexOf("title")].indexOf("Livelihoods External Data Register Form") > -1) {
var yyy = [];
for (i = 2; i < tdata.length; i++) {
var yy = tdata[i][tdata[0].indexOf("PROGRAMME_SYNOPSIS/PROGRAMME_INFORMATION/Year")];
if (tdata[i][tdata[0].indexOf("PROGRAMME_SYNOPSIS/PROGRAMME_INFORMATION/Year")] == "") { continue; }
if (yyy.indexOf(yy) == -1) {
yyy.push(yy)
/*Function schedules the CREATANALYSISSHEET task with parameter P1 - year; P2 - formid from Control Panel (Control Sheet);*/
SCHEDULE("EXTERNALDATABRGE", yy, exdata[ix][exdata[0].indexOf("formid")]);
}
}
}
}
MAP();
if (pkey != null) { return (keyinputs); }
}
|
Function createUpdateAnalysisSheet
-
createUpdateAnalysisSheet(year, formid, tempid, fcountry, formdataid, pkey)¶ The function coordinates the creation and updating of analysis data inside
- Arguments
year (string) – the current year
formid (string) – the id of form
tempid (string) – the template id
fcountry (string) – country in the form
formdataid (string) – the dataid of form
pkey (Object) – the list of key properties and their values
- Returns
keyinputs – list of key parameters.
Analysis Folder on Google Drive
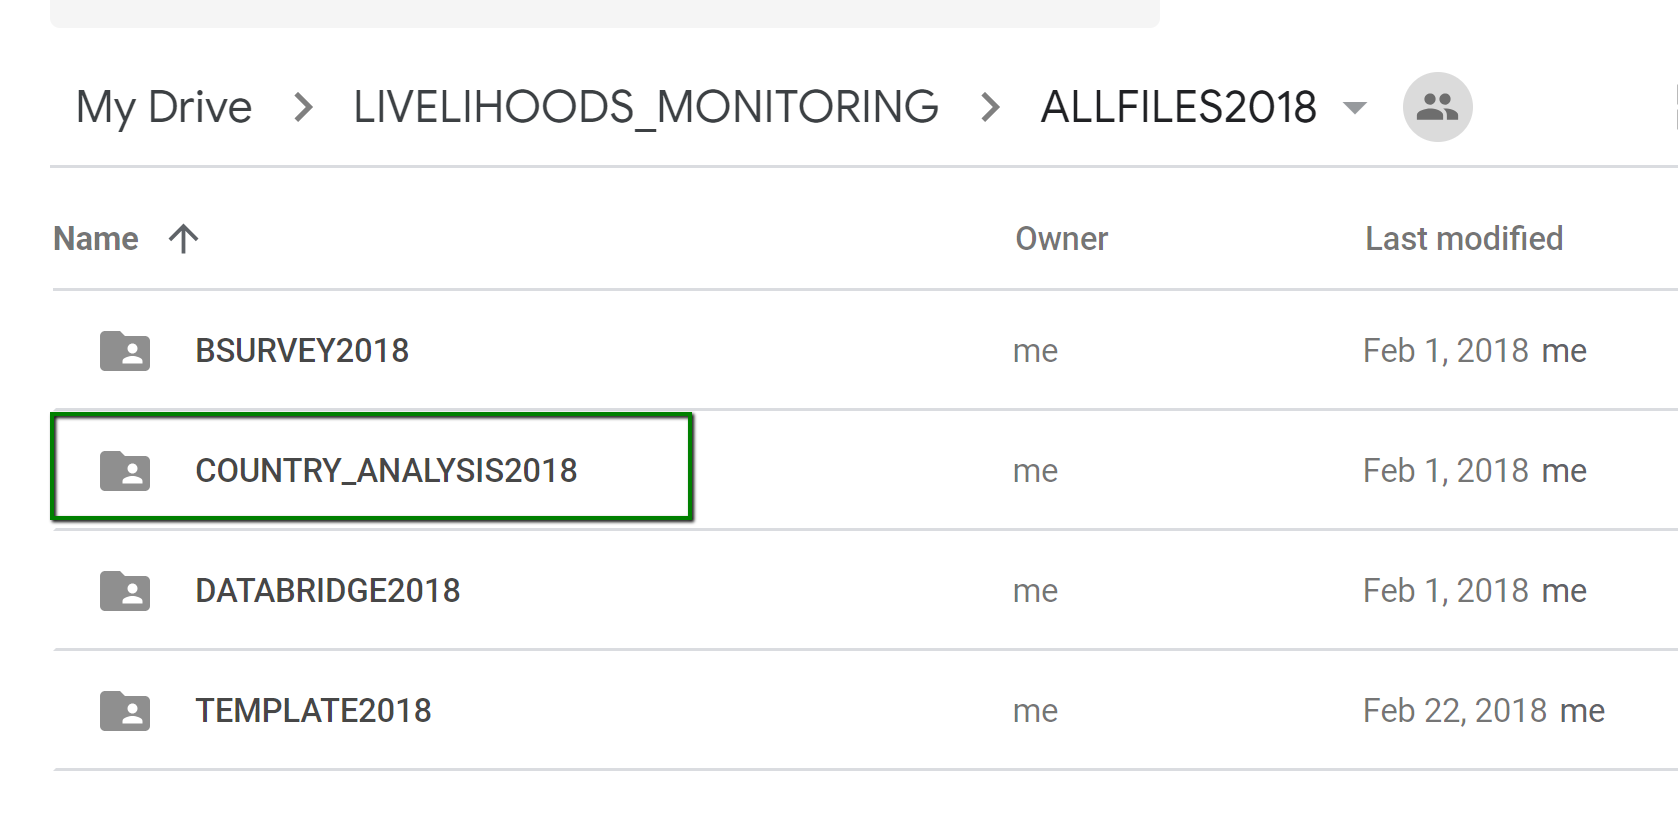
Example of Analysis Folder on Google Drive
1 2 3 4 5 6 7 8 9 10 11 12 13 14 15 16 17 18 19 20 21 22 23 24 25 26 27 28 29 30 31 32 33 34 35 36 37 38 39 40 41 42 43 44 45 46 47 48 49 50 51 52 53 54 55 56 57 58 59 60 61 62 63 64 65 66 67 68 | function createUpdateAnalysisSheet(year, formid, tempid, fcountry, formdataid, pkey) {
if (pkey != null) { key = pkey };
if (year < 2017 || year == null) { return; }
/*mainfolderid {string} - id of main folder */
var mainfolderid = createFolder(0, key["MAINFOLDER"]);
/*YearFolder {string} - id of ALLFILES folder for specific year*/
YearFolder = createFolder(mainfolderid, "ALLFILES" + year);
/*ANALYSISFOLDER {string} - id of COUNTRY_ANALYSIS folder for specific year*/
var ANALYSISFOLDER = createFolder(YearFolder, "COUNTRY_ANALYSIS" + year);
/*analysisfile {string} - the id of created file [GENERAL Component]*/
var analysisfile = createFile(key["OTHERFOLDERID"], "ANALYSISFile");
/*fname {string} - the name of the file*/
var fname = year + " " + fcountry + " ANALYSIS Livelihoods Beneficiary Survey";
var nullv = "OK";
/* check for file existence ib ANALYSIS Folder*/
/*idSS {string} - id of the file (fname2) in ANALYSIS folder [General Component]*/
var idSS = getFile(ANALYSISFOLDER, fname);
var u1 = "LASTUPDATE" + formdataid;
/*data {array} - data from KOBO,SURVEY API */
var data = connectKobotoolbox(key["APITOKEN2"], formid, "0", fcountry);
var dtemp = [];
var duser = [];
for (dt = 0; dt < data.length; dt++) {
if (dtemp.indexOf(data[dt]["TemplateID"]) == -1) {
dtemp.push(data[dt]["TemplateID"]);
duser.push(data[dt]["UID"]);
}
}
var totald = 0;
for (dtt = 0; dtt < dtemp.length; dtt++) {
if (key["LASTDATA" + dtemp[dtt]] > 0) { totald = totald + parseInt(key["LASTDATA" + dtemp[dtt]]); }
}
/*if file exists*/
if (idSS != null) {
/*LH {datastamp} - last updates*/
var LU = parseFloat(DriveApp.getFileById(idSS).getLastUpdated().getTime());
if (parseInt(totald) == data.length && LU - parseFloat(key[u1]) < 180 * 1000) { return 3; }
}
/*test*/
if (fcountry == "Zambia" && year == 2017) {
dtemp[0] = "674147";
duser[0] = "zambia";
}
/*if file doen't exist*/
if (idSS == null) {
/*folder {string} - the id of the ANALYSIS folder [gets the folder with given ID]*/
var folder = DriveApp.getFolderById(ANALYSISFOLDER);
/*file {string} - the id of file [gets the file with given ID]*/
var file = DriveApp.getFileById(analysisfile);
file.makeCopy(fname, folder);
nullv = "null";
/*files {string} - collection of all files in the Google Drive that have the given name*/
var files = folder.getFiles();
while (files.hasNext()) {
var file2 = files.next();
if (file2.getName() == fname) {
idSS = file2.getId();
}
}
|
Adding a Parametor sheet
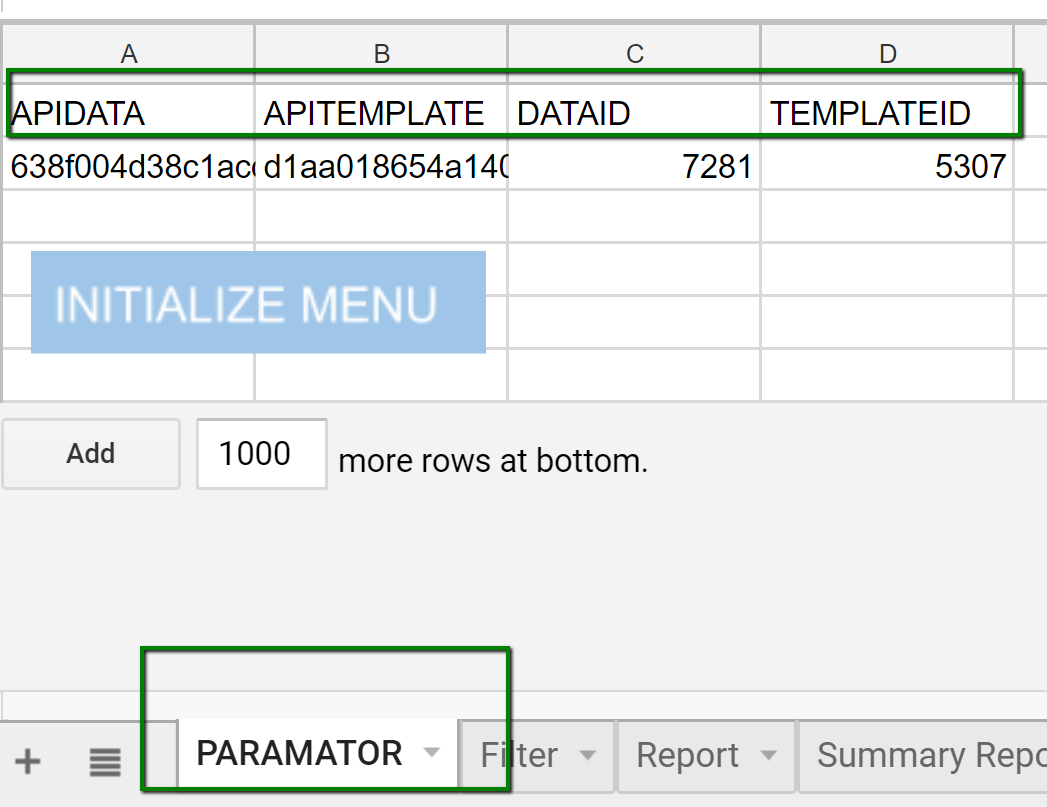
Screenshot of Parametor sheet
1 2 3 4 5 6 7 8 9 10 | var anss = SpreadsheetApp.openById(idSS);
var para = anss.getSheetByName("PARAMATOR");
var datatt = para.getRange(1, 1, para.getLastRow() + 1, para.getLastColumn()).getValues();
datatt[1][datatt[0].indexOf("APIDATA")] = key["APITOKEN2"];
datatt[1][datatt[0].indexOf("APITEMPLATE")] = key["APITOKEN"];
datatt[1][datatt[0].indexOf("DATAID")] = formid;
datatt[1][datatt[0].indexOf("TEMPLATEID")] = tempid;
para.getRange(1, 1, para.getLastRow() + 1, para.getLastColumn()).setValues(datatt);
}
|
Generating a template
1 2 3 4 5 6 7 8 9 10 11 12 13 14 15 16 17 18 19 20 21 22 23 24 25 26 27 28 29 30 31 32 33 34 35 36 37 | var url4 = DriveApp.getFileById(idSS).getUrl();
for (var dtt = 0; dtt < dtemp.length; dtt++) {
var csv4 = "CSVURL4" + dtemp[dtt];
keyinputs[csv4] = url4;
key[csv4] = url4;
}
/* control data{array} - data from Control Panle [Control Sheet] */
var controldata = getData("CONTROL");
/*c1 {number} - index number of year in data [Control Sheet] */
var c1 = controldata[0].indexOf("PROGRAMME_SYNOPSIS/PROGRAMME_INFORMATION/Year");
/*c2 {number} - index numbe of username in data [Control Sheet] */
var c2 = controldata[0].indexOf("Username");
/*c3 {number} - index number of dataid in data [Control Sheet] */
var c3 = controldata[0].indexOf("_id");
/*c4 {number} - index number of country in data [Control Sheet] */
var c4 = controldata[0].indexOf("CONTACT_INFORMATION/Country");
var anss = SpreadsheetApp.openById(idSS);
/*ppgsheet {sheet} - ppg sheet*/
var ppgsheet = anss.getSheetByName("PPG");
/*parametor {sheet} - ppg sheet*/
var para = anss.getSheetByName("PARAMATOR");
var fid = para.getRange(2, 4).getValue();
/*PPGNAMES {array} - connect to KOBO (Survey API token)*/
var PPGNAMES = connectKobotoolbox(key["APITOKEN"], fid);
var PPGdata = [];
var y = 0;
var username = "";
var add = 0;
var existing = ppgsheet.getDataRange().getValues();
|
PPG sheet
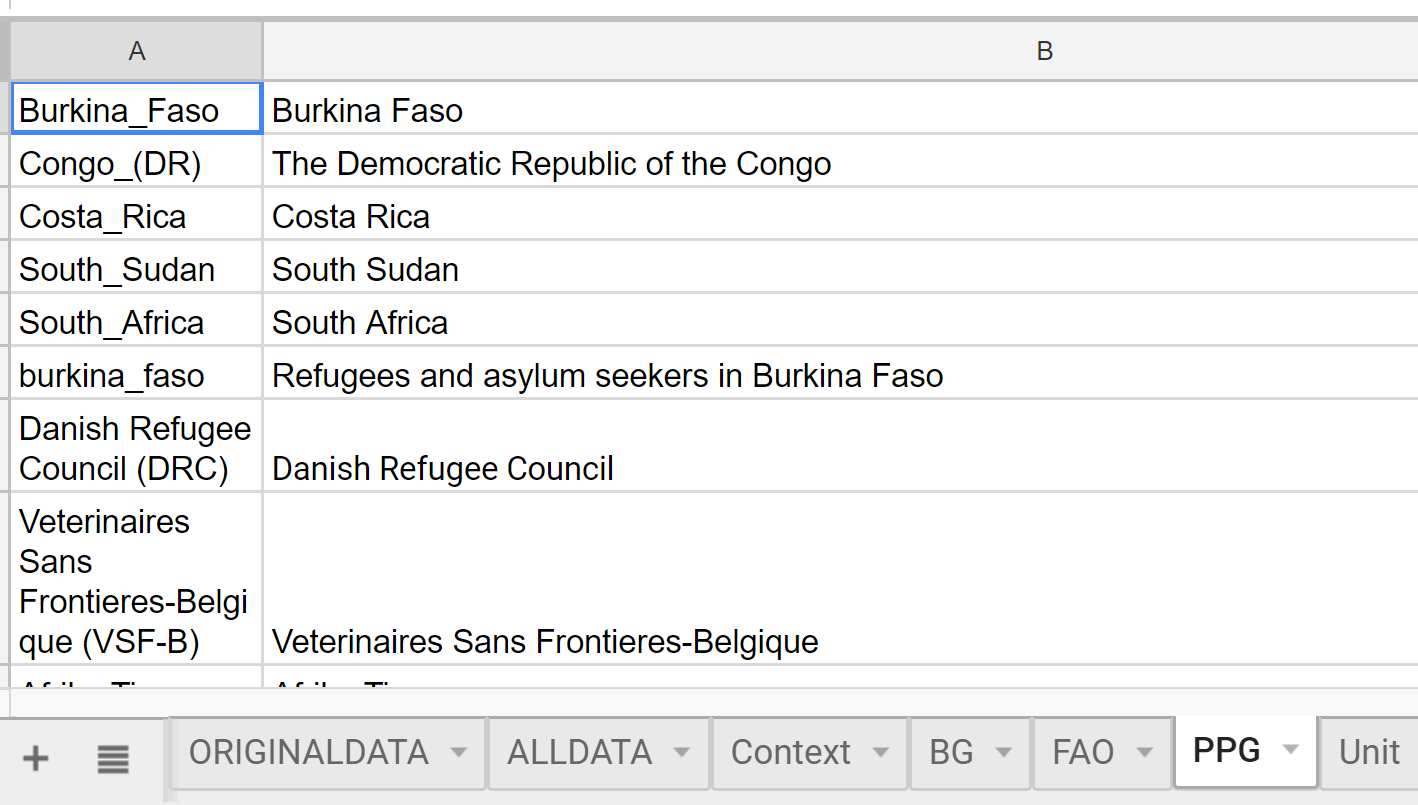
Screenshot of PPG sheet
1 2 3 4 5 6 7 8 9 10 11 12 13 14 15 16 17 18 19 20 21 22 23 24 25 26 27 28 29 30 31 32 33 34 35 36 37 38 39 40 41 42 43 44 45 46 47 48 49 50 51 52 53 54 55 56 57 58 59 60 61 62 | for (c = 1; c < controldata.length; c++) {
if (controldata[c][c3] == formdataid) { username = controldata[c][controldata[0].indexOf("Username")]; }
if (controldata[c][c1] != year || controldata[c][c4] != fcountry) { continue; }
PPGdata[y] = new Array();
PPGdata[y][0] = controldata[c][c2];
for (p = 0; p < PPGNAMES.length; p++) {
if (controldata[c][c3] == PPGNAMES[p]["_id"]) {
var counte = 0;
for (var e = 0; e < existing.length; e++) {
if (existing[e][0] == controldata[c][c2]) { counte++; break; }
}
if (counte == 0) {
add = 1;
PPGdata[y] = new Array();
PPGdata[y][0] = controldata[c][c2];
PPGdata[y][1] = PPGNAMES[p]["PROGRAMME_SYNOPSIS/PROGRAMME_INFORMATION/PPG"].replace("_", " ");
y++;
}
/*Taking partner names from template*/
for (ipp = 0; ipp < PPGNAMES[p]['PROGRAMME_SYNOPSIS/PROJECT_INFORMATION/Partner'].length; ipp++) {
var counte2 = 0;
for (var e = 0; e < existing.length; e++) {
if (existing[e][0] == PPGNAMES[p]['PROGRAMME_SYNOPSIS/PROJECT_INFORMATION/Partner'][ipp]['PROGRAMME_SYNOPSIS/PROJECT_INFORMATION/Partner/PARTNER_INFORMATION/Partner_Name'].replace(/_/g, " ")) { counte2++; break; }
}
if (counte2 == 0) {
add = 1;
PPGdata[y] = new Array();
PPGdata[y][0] = (PPGNAMES[p]['PROGRAMME_SYNOPSIS/PROJECT_INFORMATION/Partner'][ipp]['PROGRAMME_SYNOPSIS/PROJECT_INFORMATION/Partner/PARTNER_INFORMATION/Partner_Name'].replace(/_/g, " "));
PPGdata[y][1] = "";
y++;
}
}
}
}
}
if (add > 0) { ppgsheet.getRange(ppgsheet.getLastRow() + 1, 1, PPGdata.length, 2).setValues(PPGdata); }
keyinputs["idx"] = idSS;
/*This Global Valiable controls the working analysis sheet across the years*/
key["idx"] = idSS;
updateLog("BS Analysis Sheet updated No.1 : (Start) " + year);
/*functions improt data from Kobo, syncronise, harmonise, calcilate denepdency ratio and filter [Data Analysis Component]*/
getgetAllData(fcountry, data);
/*Harmonization [Data Analysis Component]*/
syncroLHsHarmonization();
/* ON or OFF for endline survey data to be exported and analysed.*/
var EOF = key["EOF" + formdataid];
/*Harmonise the names of crop/animals and conversion rate for all the data (new and old) again [Data Analysis Component]*/
harmoniseData(EOF,formdataid);
//OUTLIERS();
recalculateTopBottomThresholds();
|
Schedule a SAMPLEPROFILE Task

Example of SAMPLEPROFILE Task
1 2 3 4 5 6 7 8 9 10 11 12 13 14 15 16 17 18 19 20 21 22 23 | for (var dtt = 0; dtt < dtemp.length; dtt++) {
dcount = 0;
for (dt = 0; dt < data.length; dt++) {
if (data[dt]["TemplateID"] == dtemp[dtt] || data[dt]["UID"] == duser[dtt]) {
dcount++;
}
}
var k2 = "LASTDATA" + dtemp[dtt];
if (parseInt(key[k2]) != dcount) {
/*Function schedules the SAMPLEPROFILE task with parameter P1 - year; P2 -fusername ; P3 - DATAID (Control Sheet) equal TEMPLATEID (ALL DATA)*/
SCHEDULE("SAMPLEPROFILE", year, duser[dtt], dtemp[dtt]);
keyinputs[k2] = dcount;
}
/*The function counts the data cleaned (dataid, username) [CONTROL component]*/
calculateCleaningProgress(dtemp[dtt], duser[dtt])
/*Function checks the updates on customisation [UPDATE CHECK]*/
updateOnCustomisation(dtemp[dtt]);
}
/*take the time*/
keyinputs[u1] = DriveApp.getFileById(idSS).getLastUpdated().getTime();
if (pkey != null) { return (keyinputs); }
return 1;
|
Function recalculateTopBottomThresholds
-
recalculateTopBottomThresholds()¶ The function recalculates top/bottom thresholds. The reason is to avoid 5 minutes limit
1 2 3 4 5 6 7 8 9 10 11 12 13 14 15 16 17 18 19 20 21 22 | function recalculateTopBottomThresholds() {
/*calcaulates the ourliers and populates with data on OURTLIERR [DATA_ANALYSIS Component]*/
calculateOutlier();
/*compare the data on ALLDATA and ORIGINALDATA sheet based on caluclations (percentages) [DATA_ANALYSIS component]*/
overwriteOutlier();
/*idx {string } - year*/
var idx = key["idx"];
/*file {string} - the file with the given ID*/
var file = DriveApp.getFileById(idx);
/*Gets a collection of folders that are immediate parents of the File*/
var fileParents = file.getParents();
var filename = fileParents.next().getName()
var year;
for (y = 2017; y < 2030; y++) {
if (filename.indexOf(y) > -1) { year = y; break; }
}
updateLog("BS Analysis Sheet updated No.5 (Outlier Control)");
return 1;
}
|
Function checkAnalysisNote
-
checkAnalysisNote()¶ The function checks the submissions for each template and decides to update or not the country analysis note
1 2 3 4 5 | function checkAnalysisNote()
{
calculateCleaningProgress("ALL");
return 1;
}
|
Function extractAnalysisNote
-
extractAnalysisNote(year, fcountry, fusername, fdutystation, formid, pkey)¶ The function coordinates extraction of country analysis note
- Arguments
year (Object) – current year
fcountry (Object) – form country
fusername (Object) – form username
fdutystation (Object) – location
formid (Object) – id of the form
pkey (Object) – the list of key properties and their values
- Returns
keyinputs – list of key parameters.
Locate the file in the folder, and if it does not exist create new one. Set the idx address (datasheet id) so that the code in different functions can work on the correct DataSheet through global variables.
1 2 3 4 5 6 7 8 9 10 11 12 13 14 15 16 17 18 19 20 21 22 23 24 25 | function extractAnalysisNote(year, fcountry, fusername, fdutystation, formid, pkey)
{
if (pkey != null) { key = pkey };
if (year < 2017 || key["COUNTRYNOTE" + formid] == "OK") {
/*return status 'CANCELED' on Task sheet*/
return 3;
}
if (key["CLEAN" + formid] == 0) { keyinputs["COUNTRYNOTE" + formid] = "OK"; key["COUNTRYNOTE" + formid] = "OK"; return 3; }
/*mainfolderid {string} - id of main folder */
var mainfolderid = createFolder(0, key["MAINFOLDER"]);
/*YearFolder {string} - id of ALLFILES folder for specific year*/
YearFolder = createFolder(mainfolderid, "ALLFILES" + year);
/*ANALYSISFOLDER {string} - id of COUNTRY_ANALYSIS folder for specific year*/
var ANALYSISFOLDER = createFolder(YearFolder, "COUNTRY_ANALYSIS" + year);
/*Generating the name of the file Country > Place*/
if (fdutystation != null) { var fname = year + " " + fcountry + "_" + fdutystation + " Country Analysis Note"; }
else { var fname = year + " " + fcountry + " Country Analysis Note"; }
var fname2 = year + " " + fcountry + " ANALYSIS Livelihoods Beneficiary Survey";
/*check for file existence*/
/*idSS {string} - id of the file (fname2) in ANALYSIS folder [General Component]*/
var idSS = getFile(ANALYSISFOLDER, fname2);
|
Schedule CREATEANALYSISHEET or ANALYSISNOTEEXTRACT Task

Example of CREATEANALYSISHEET or ANALYSISNOTEEXTRACT Task
1 2 3 4 5 6 7 8 9 10 11 12 13 14 | /*IF file doesn't exist, schedules the creating one and repeats the task */
if (idSS == null) {
/*tdata {array} - data from CONTROL sheet (GENERAL component)*/
var tdata = getData("CONTROL");
for (it = 0; it < tdata.length; it++) {
if (tdata[it][tdata[0].indexOf("PROGRAMME_SYNOPSIS/PROGRAMME_INFORMATION/Year")] == year) {
tempid = tdata[it][tdata[0].indexOf("formid")];
SCHEDULE("CREATEANALYSISSHEET", fyear, bdata[i][bdata[0].indexOf("formid")], tempid, fcountry);
break;
}
SCHEDULE("ANALYSISNOTEEXTRACT", year, fcountry, fusername, fdutystation, formid);
return;
}
}
|
Add Fllter sheet in Beneficiary data sheet [ALLFILESYear >COUNTRY_ANALYSISYEAR>Year Country Analysis Livelihoods Beneficiary Survey]
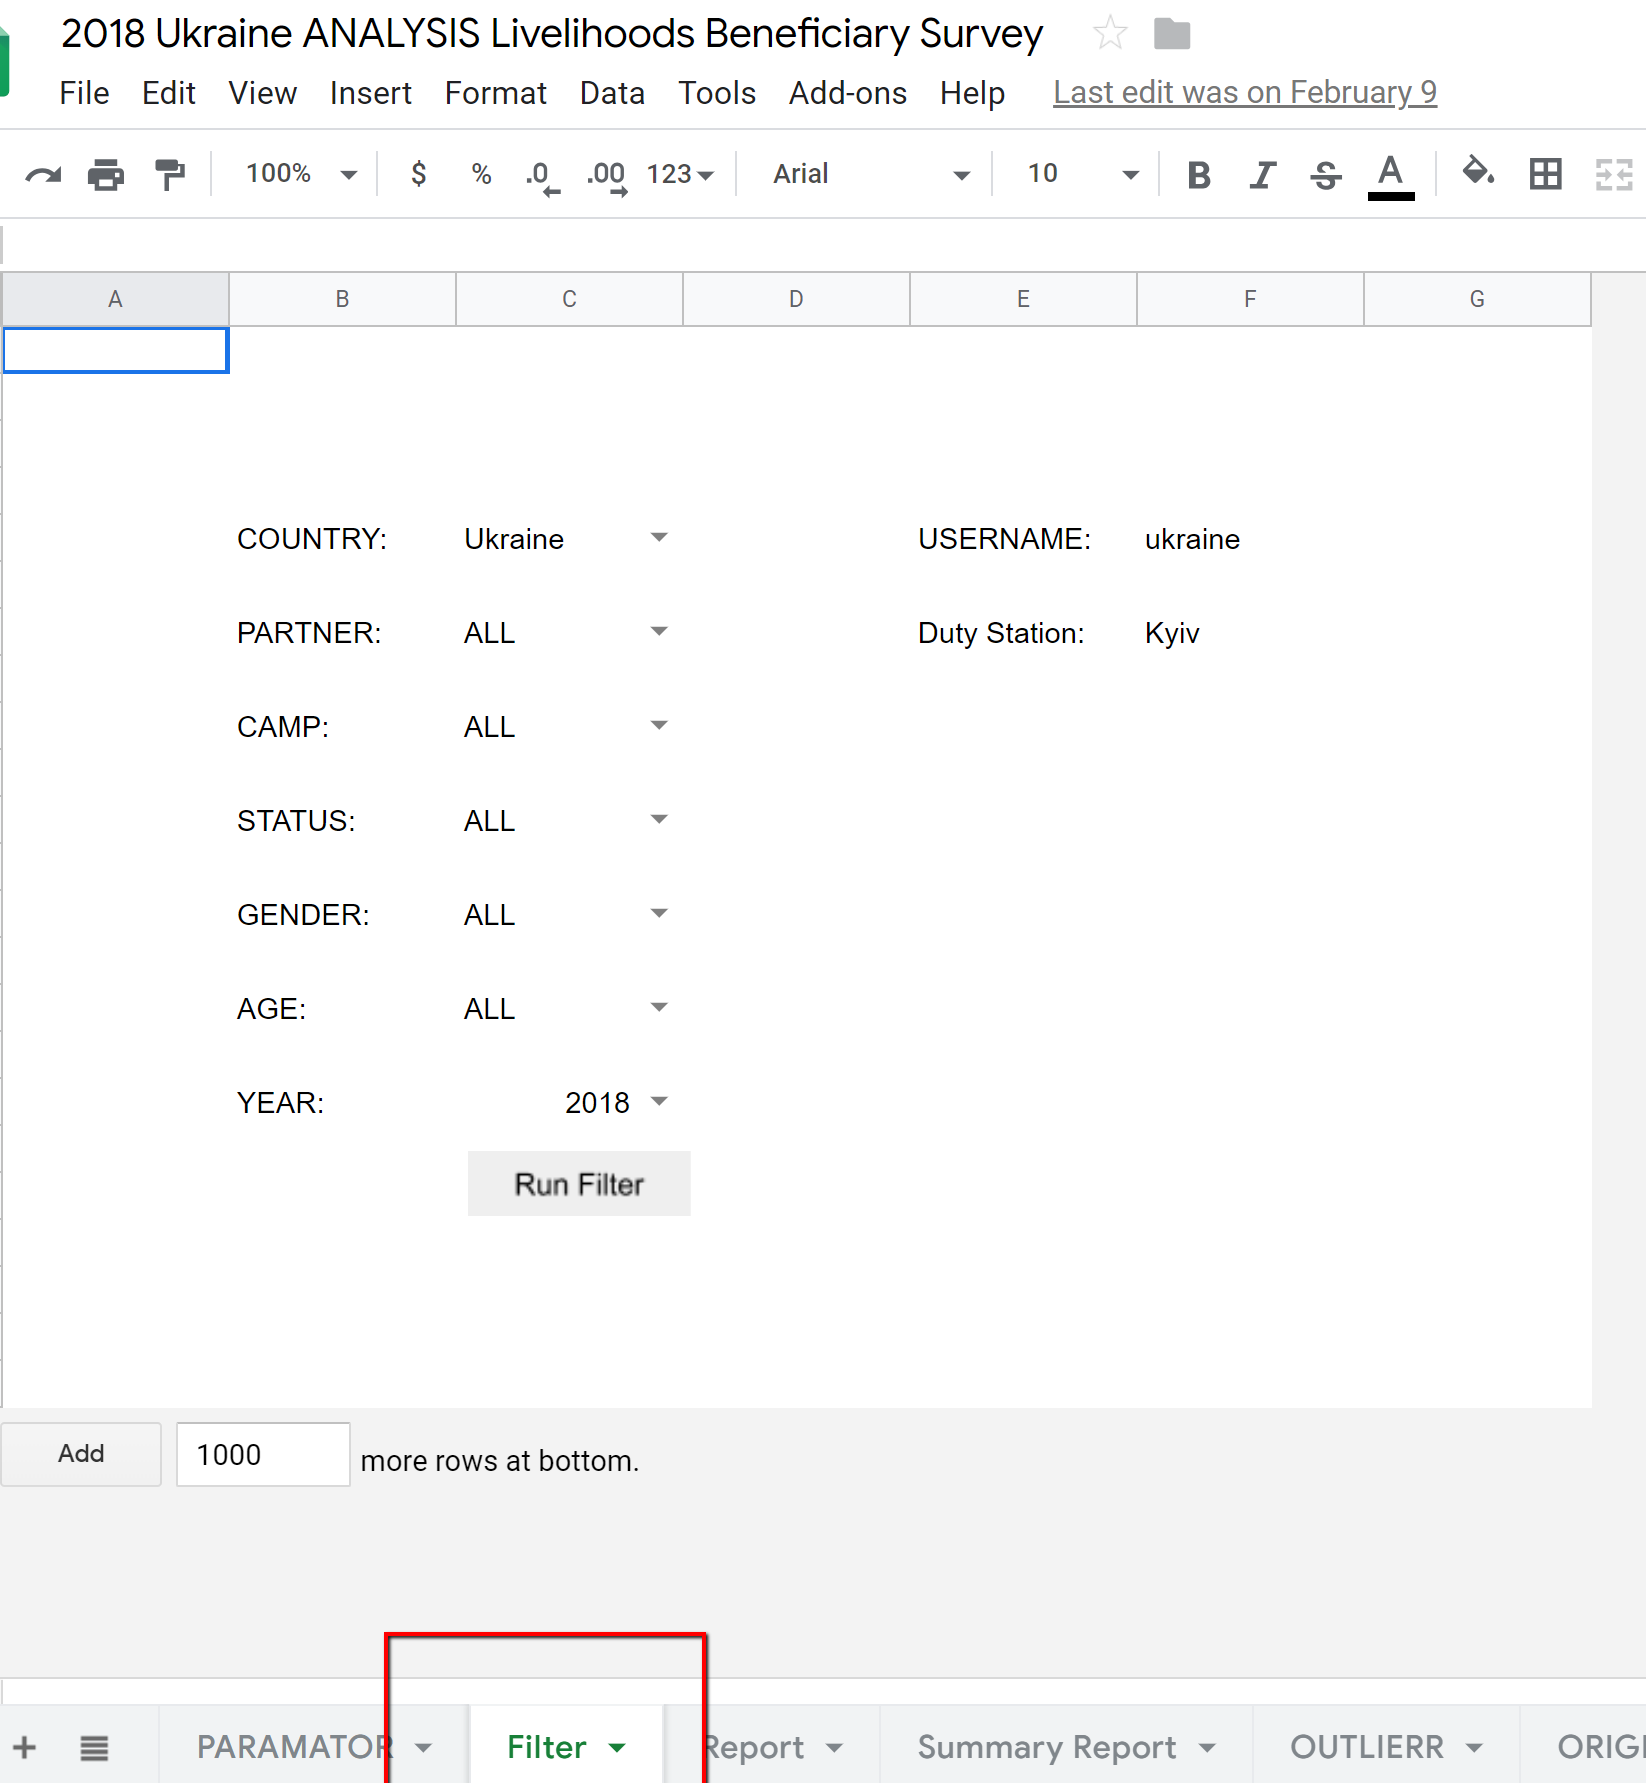
Example of Filter sheet
1 2 3 4 5 6 7 8 9 10 11 12 13 14 15 16 17 18 19 20 21 22 23 24 25 26 27 28 29 30 31 32 33 34 35 36 37 38 39 40 41 42 43 44 | /*anss {object} - spreadsheet object with the given id [Opens the spreadsheet with the given ID]*/
var anss = SpreadsheetApp.openById(idSS);
/*para {Object} - get the FILTER sheet */
var para = anss.getSheetByName("filter");
var data = para.getRange(1, 1, para.getLastRow() + 1, para.getLastColumn() + 1).getValues();
for (i = 0; i < data.length; i++) {
if (data[i][1] == "COUNTRY:") {
data[i][2] = fcountry;
}
if (data[i][4] == "USERNAME:") {
if (fusername == null) {
data[i][5] = "";
} else {
data[i][5] = fusername;
}
}
if (data[i][4] == "Duty Station:") {
if (fdutystation == null) {
data[i][5] = "";
} else {
data[i][5] = fdutystation;
}
}
if (data[i][1] == "PARTNER:") {
data[i][2] = "ALL";
}
if (data[i][1] == "CAMP:") {
data[i][2] = "ALL";
}
if (data[i][1] == "STATUS:") {
data[i][2] = "ALL";
}
if (data[i][1] == "GENDER:") {
data[i][2] = "ALL";
}
if (data[i][1] == "AGE:") {
data[i][2] = "ALL";
}
if (data[i][1] == "YEAR:") {
data[i][2] = year;
}
}
para.getRange(1, 1, para.getLastRow() + 1, para.getLastColumn() + 1).setValues(data);
|
Read Partner Survey Data

Screenshot of Partner data
1 2 3 4 5 6 7 | var urlp = key["CSVURL5" + year];
var idSSp = urlp.replace('https://docs.google.com/spreadsheets/d/', '');
idSSp = idSSp.replace('/edit?usp=drivesdk', '');
/*ssp {object} - spreadsheet object with the given id [Opens the spreadsheet with the given ID]*/
var ssp = SpreadsheetApp.openById(idSSp);
/*alldatap {Object} - get the ALLDATA sheet [Partner Survey] */
var alldatap = ssp.getSheetByName("ALLDATA");
|
ExchangeRate sheet in Partner data [ALLFILESYear >COUNTRY_ANALYSISYEAR>Year Partner Data]
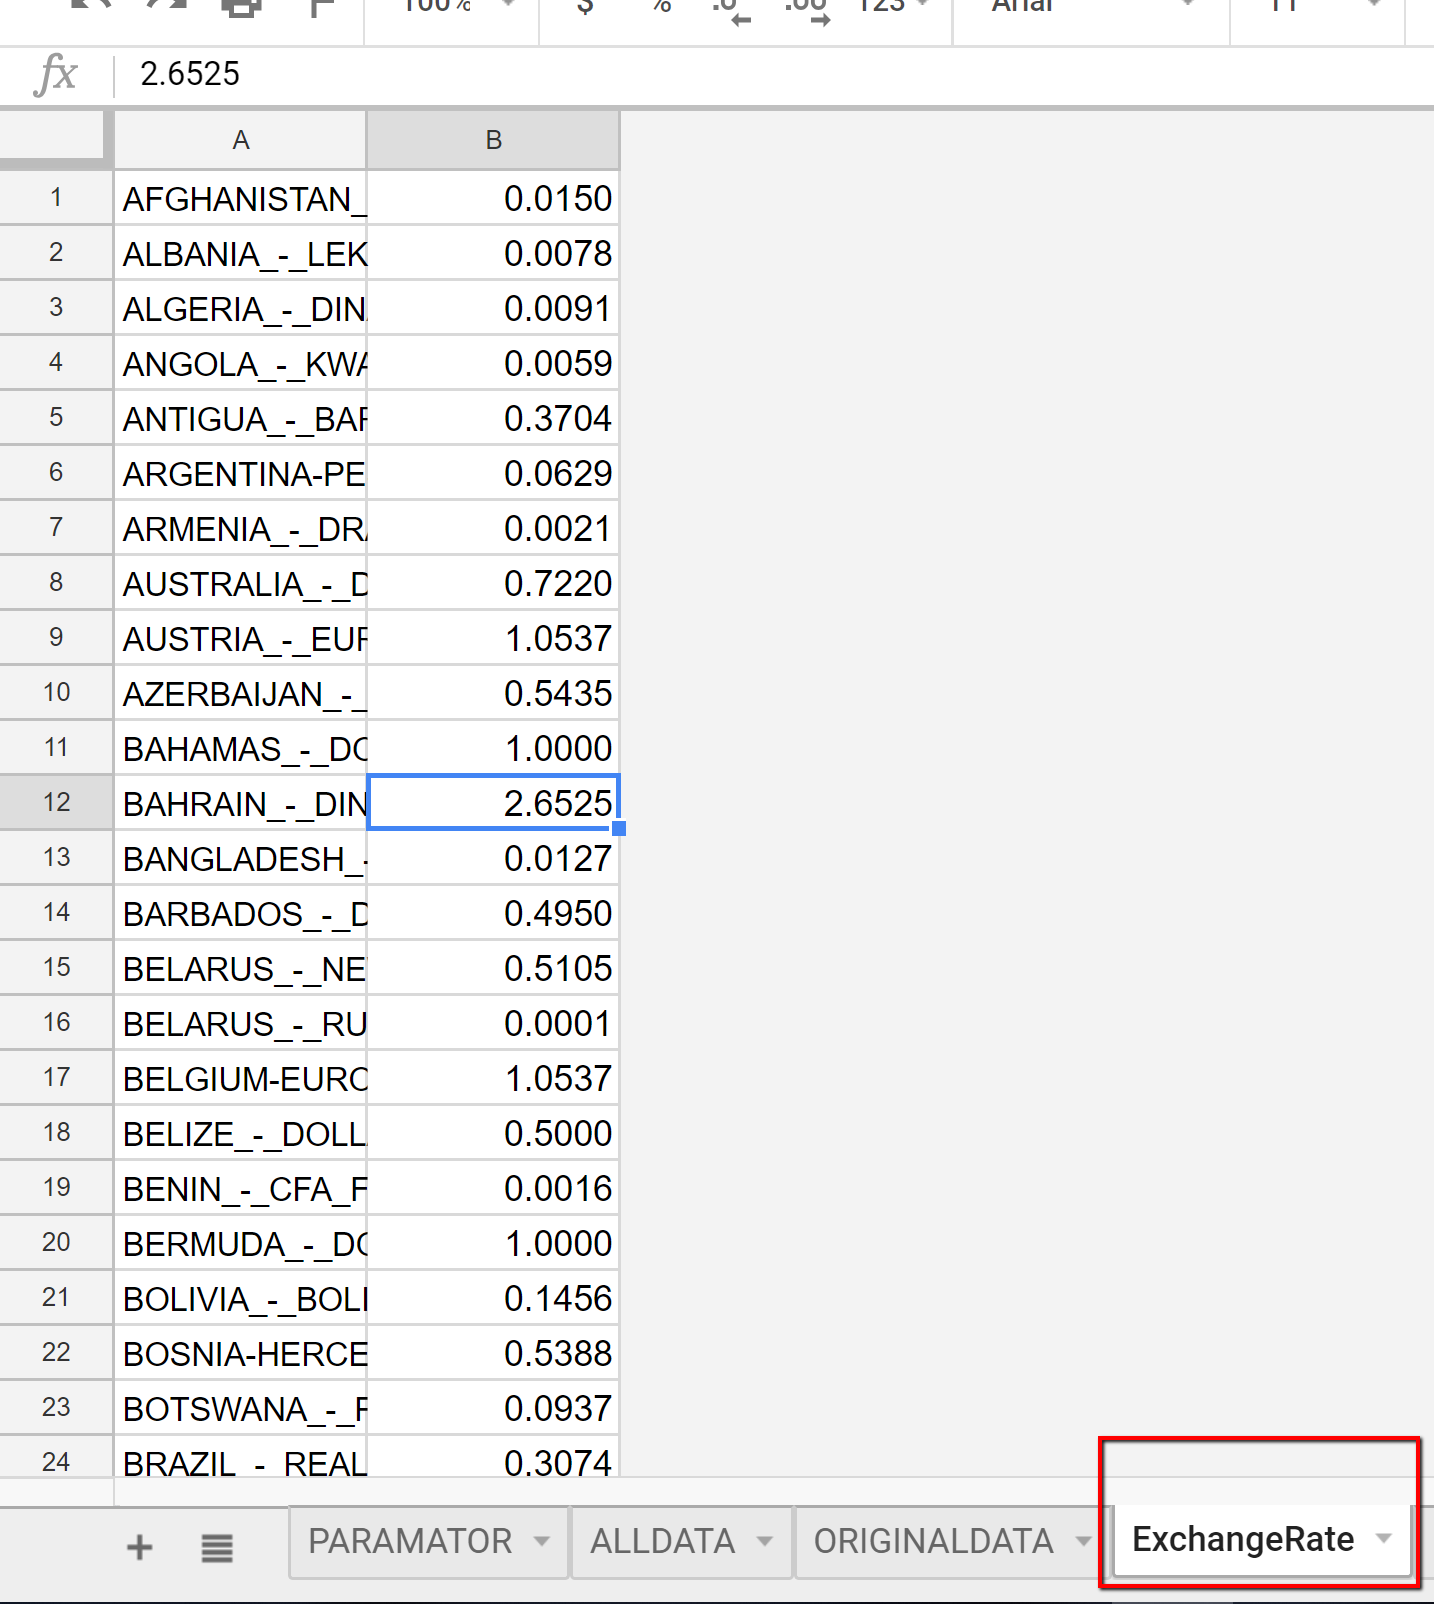
Screenshot of ExchangeRate data
1 2 3 4 5 6 7 8 9 10 11 12 13 14 15 16 17 18 19 20 21 22 23 24 25 26 27 28 29 30 31 32 33 34 35 36 37 38 39 40 41 42 43 | /*pexs {Object} - get the ExchangeRate sheet [Partner Survey] */
var pexs = ssp.getSheetByName("ExchangeRate");
var jP = alldatap.getDataRange().getValues();
var c1 = jP[0].indexOf("TemplateID");
var c2 = jP[0].indexOf("Country");
var pex = pexs.getDataRange().getValues();
/*Filter only the template ID matchea*/
jsonPartner = jP.filter(function (dataRow) {
var x = 1;
if (dataRow[0] == "today") { x = 0; }
if (dataRow[c1] == formid) { x = 0; }
if (dataRow[c2] == "Zambia" && fcountry == "Zambia") { x = 0; }
return x === 0;
});
/*Get exchange rate*/
if (jsonPartner.length > 1) {
for (p = 0; p < pex.length; p++) {
if (pex[p][0] == jsonPartner[1][jsonPartner[0].indexOf("PARTNER_INFO/LocalCurrency2")]) {
pexr = pex[p][1];
break;
}
}
}
/*partner name label*/
var nlist = [];
partnernamesp = "(";
for (pu = 1; pu < jsonPartner.length; pu++) {
if (nlist.indexOf(jsonPartner[pu][jsonPartner[0].indexOf("PARTNER_INFO/PARTNER")]) == -1) {
nlist.push(jsonPartner[pu][jsonPartner[0].indexOf("PARTNER_INFO/PARTNER")])
partnernamesp = partnernamesp.replace("#", "");
partnernamesp = partnernamesp + jsonPartner[pu][jsonPartner[0].indexOf("PARTNER_INFO/PARTNER")] + ",# ";
}
}
partnernamesp = partnernamesp.replace(",# ", "");
partnernamesp = partnernamesp + ")";
keyinputs["idx"] = idSS;
/*global valiable controls the working analysis sheet across the years*/
key["idx"] = idSS;
/*Function extract country analysis note on country_analysis_note sheet [Data Analysis Sheet]*/
|
Generate2
1 | extractCountryAnalysisNote();
|
Country Analysis File
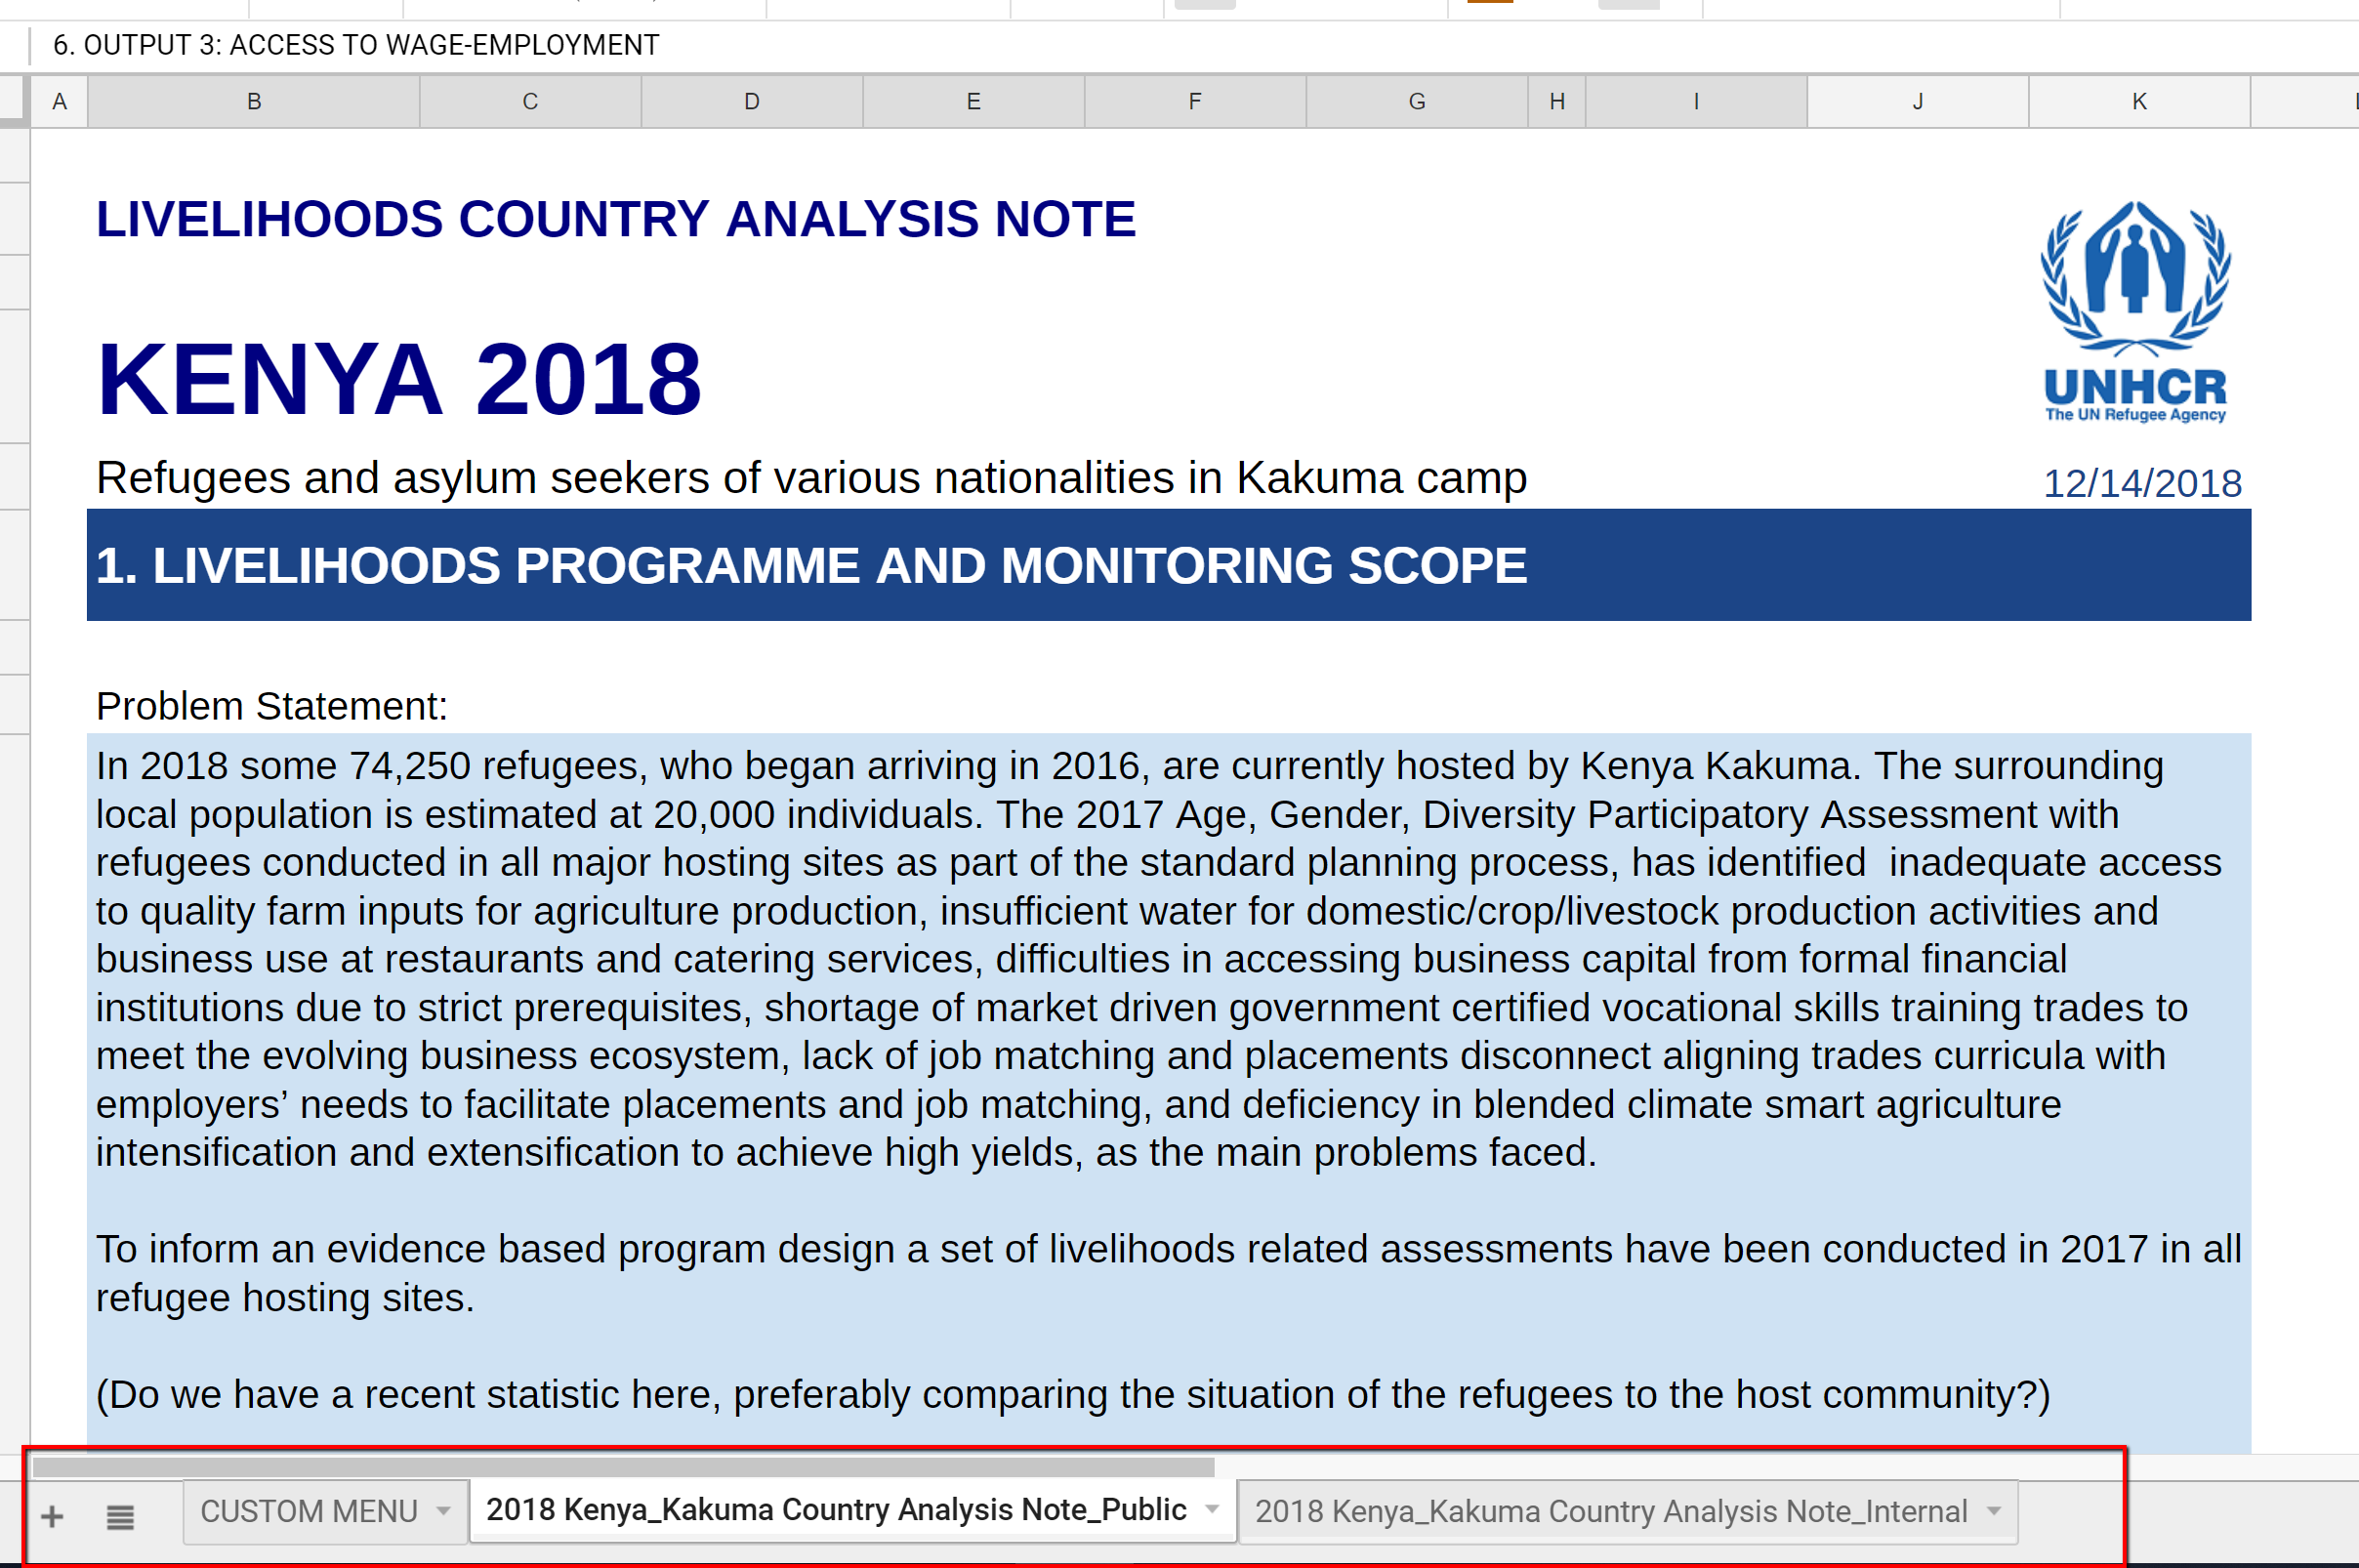
Example of Country Analysis File
1 2 3 4 5 6 7 8 9 10 11 12 13 14 15 16 17 18 19 20 21 22 23 24 25 26 27 28 29 30 31 32 33 34 35 36 37 38 39 40 41 42 43 44 45 46 47 48 49 50 51 52 53 54 55 56 57 58 59 60 61 62 63 64 65 66 67 68 69 70 71 72 73 74 75 76 77 78 79 80 81 82 83 84 85 86 87 88 89 90 91 92 93 94 95 96 97 98 99 100 101 102 103 104 105 106 107 108 109 110 111 112 113 114 115 116 117 118 119 120 121 122 123 124 125 126 127 | extractCountryAnalysisNote();
/*function creates a new file (folderid,fileName) [GENERAL component]*/
var x = createFile(ANALYSISFOLDER, fname);
var oldfile = DriveApp.getFileById(x);
/*old {object} - spreadsheet object with the given id [Opens the spreadsheet with the given ID]*/
var old = SpreadsheetApp.openById(x);
/*oldsheet {Object} - get the country analysis _Public sheet */
var oldsheet = old.getSheetByName(fname + "_Public");
/*oldsheet2 {Object} - get the country analysis _Internal sheet */
var oldsheet2 = old.getSheetByName(fname + "_Internal");
try { if (oldsheet2.getLastRow() > 0) { } } catch (e) { oldsheet2 = old.getSheetByName(fname); }
try {
var pdfpagebreak2 = oldsheet2.getRange(1, 1, oldsheet2.getLastRow(), 1).getValues();
var pdfpagebreak = oldsheet.getRange(1, 1, oldsheet.getLastRow(), 1).getValues();
} catch (e) { }
oldfile.setTrashed(true);
/*function creates a new file (folderid,fileName) [GENERAL component]*/
var templatefile = createFile(key["OTHERFOLDERID"], "AnalysisCode");
var folder = DriveApp.getFolderById(ANALYSISFOLDER);
var file = DriveApp.getFileById(templatefile);
file.makeCopy(fname, folder);
/*Obtaining ID of the file*/
var files = folder.getFiles();
while (files.hasNext()) {
var file2 = files.next();
if (file2.getName() == fname) {
var newfile = file2.getId();
}
}
/*ss_copyTo {object} - spreadsheet object with the given id [Opens the spreadsheet with the given ID]*/
var ss_copyTo = SpreadsheetApp.openById(newfile);
var sheet1 = ss_copyTo.getSheetByName('Sheet1');
/*countryanalysisreport {Object} - get the country analysis _Public sheet */
var countryanalysisreport = ss.getSheetByName("COUNTRY_ANALYSIS_NOTE");
var npublic;
var npublic2;
try {
countryanalysisreport.copyTo(ss_copyTo).setName(fname + "_Public");
countryanalysisreport.copyTo(ss_copyTo).setName(fname + "_Internal");
} catch (e) {
var oldfile = DriveApp.getFileById(createFile(ANALYSISFOLDER, fname));
oldfile.setTrashed(true);
countryanalysisreport.copyTo(ss_copyTo).setName(fname + "_Public");
countryanalysisreport.copyTo(ss_copyTo).setName(fname + "_Internal");
}
ss_copyTo.deleteSheet(sheet1);
/*In internal version (without cost indicatros)*/
npublic = ss_copyTo.getSheetByName(fname + "_Public");
npublic2 = ss_copyTo.getSheetByName(fname + "_Internal");
var internaldata = npublic2.getRange(1, 1, npublic2.getLastRow(), 2).getValues();
var iy = 0;
for (ind = 0; ind < internaldata.length; ind++) {
if (internaldata[ind][1] == "Average cost of productive assets received per beneficiary (Crop production) per year") {
npublic.deleteRow(ind + 1 - iy); iy++;
if (internaldata[ind + 1][1] == "") { npublic.deleteRow(ind + 2 - iy); iy++; }
if (internaldata[ind + 1][1].indexOf("Note: The information on the average amount of assistance provided") > -1) { npublic.deleteRow(ind + 2 - iy); iy++; }
}
if (internaldata[ind][1] == "Average cost of productive assets received per beneficiary (Livestock) per year") {
npublic.deleteRow(ind + 1 - iy); iy++;
if (internaldata[ind + 1][1] == "") { npublic.deleteRow(ind + 2 - iy); iy++; }
if (internaldata[ind + 1][1].indexOf("Note: The information on the average amount of assistance provided") > -1) { npublic.deleteRow(ind + 2 - iy); iy++; }
}
if (internaldata[ind][1] == "Average cost of productive assets received per beneficiary (Fishery) per year") {
npublic.deleteRow(ind + 1 - iy); iy++;
if (internaldata[ind + 1][1] == "") { npublic.deleteRow(ind + 2 - iy); iy++; }
if (internaldata[ind + 1][1].indexOf("Note: The information on the average amount of assistance provided") > -1) { npublic.deleteRow(ind + 2 - iy); iy++; }
}
if (internaldata[ind][1] == "Average value of cash grants per beneficiary per year for agricultural production") {
if (internaldata[ind + 1][1] == "") { npublic.deleteRow(ind + 2 - iy); iy++; }
}
if (internaldata[ind][1] == "Average value of support to protect agricultural productive assets per beneficiary per year") {
npublic.deleteRow(ind + 1 - iy); iy++;
if (internaldata[ind + 1][1] == "") { npublic.deleteRow(ind + 2 - iy); iy++; }
if (internaldata[ind + 1][1].indexOf("Note: The information on the average amount of assistance provided") > -1) { npublic.deleteRow(ind + 2 - iy); iy++; }
}
if (internaldata[ind][1] == "Average cost of productive assets (to start/improve a business) received per beneficiary per year") {
npublic.deleteRow(ind + 1 - iy); iy++;
if (internaldata[ind + 1][1] == "") { npublic.deleteRow(ind + 2 - iy); iy++; }
if (internaldata[ind + 1][1].indexOf("Note: The information on the average amount of assistance provided") > -1) { npublic.deleteRow(ind + 2 - iy); iy++; }
}
if (internaldata[ind][1] == "Average value of cash grants (to start/improve a business) received per beneficiary per year") {
if (internaldata[ind + 1][1] == "") { npublic.deleteRow(ind + 2 - iy); iy++; }
}
if (internaldata[ind][1] == "Average cost of productive assets (to engage in wage employment) received per beneficiary per year") {
npublic.deleteRow(ind + 1 - iy); iy++;
if (internaldata[ind + 1][1] == "") { npublic.deleteRow(ind + 2 - iy); iy++; }
if (internaldata[ind + 1][1].indexOf("Note: The information on the average amount of assistance provided") > -1) { npublic.deleteRow(ind + 2 - iy); iy++; }
}
if (internaldata[ind][1] == "Average value of cash grants (to help find or maintain a job) received per beneficiary per year") {
if (internaldata[ind + 1][1] == "") { npublic.deleteRow(ind + 2 - iy); iy++; }
}
}
/*PDF break*/
try { npublic.getRange(1, 1, oldsheet.getLastRow(), 1).setValues(pdfpagebreak); } catch (e) { }
try { npublic2.getRange(1, 1, oldsheet2.getLastRow(), 1).setValues(pdfpagebreak2); } catch (e) { }
/*Registrin pdf file link to keys*/
var newurl = DriveApp.getFileById(newfile).getUrl();
var cn = 'CNOTE' + formid;
keyinputs[cn] = newurl;
keyinputs["COUNTRYNOTE" + formid] = "OK";
key[cn] = newurl;
key["COUNTRYNOTE" + formid] = "OK";
|
updateOnCustomisation()
1 | updateOnCustomisation(formid);
|
EMAILNOTICE()
1 2 3 4 5 6 7 8 9 10 11 12 13 14 | /*EMAILNOTICE*/
if (key["EMAIL"] == "ON") {
generateEmailNotice(formid,
"Country Analysis Note Created / Updated",
"Country Analysis Note has been created or updated based on the latest data.",
newfile,
"Please find below the link to the latest Country Analysis Note based on the latest data submitted. Should you have any comments/questions, please do not hesitate to contact the HQ focal point.");
}
updateLog("County Analysis Note updated: " + year + " " + fname);
if (pkey != null) { return (keyinputs); }
return 1;
}
|
General Variables
1 2 3 4 5 6 7 8 9 10 11 12 | { /*General settings*/
var sumsheet;
var graphcolor;
var titlecolor;
var XX = 1,
YY = 1;
var y = 26,
x = 2;
var y2,
x2;
var Country2;
}
|
DataLoad Variables
1 2 3 4 5 6 7 8 | var APIDATA = key["APITOKEN2"];
var APITEMPLATE = key["APITOKEN"];
var jsonData;
var jsonTemplate;
var jsonPartner;
var pexr;
var partnernamesp;
|
Function loadDataTemplate
-
loadDataTemplate()¶ The function loads data for template
1 2 3 4 5 6 7 8 9 10 11 12 | function loadDataTemplate() {
var idx = key["idx"];
/*idx {string } - year*/
/*sst {object} - spreadsheet object with the given id [Opens the spreadsheet with the given ID]*/
var parametor = SpreadsheetApp.openById(idx).getSheetByName("PARAMATOR");
var TEMPLATEID = parametor.getRange(2, 4).getValue();
var url = 'https://kobocat.unhcr.org/api/v1/data/' + TEMPLATEID
/* Retrieve bound-script project */
var json = UrlFetchApp.fetch(url, fetchTemplate());
jsonTemplate = JSON.parse(json.getContentText());
Logger.log(jsonTemplate);
}
|
Function fetchSurvey
-
fetchSurvey()¶ The function gets resources from SURVEY account
1 2 3 4 5 6 7 | function fetchSurvey() {
return {
"headers": {
"Authorization": "Token " + key["APITOKEN2"],
}
};
}
|
Function fetchTemplate
-
fetchTemplate()¶ The function gets resources from SURVEY account
1 2 3 4 5 6 7 | function fetchTemplate() {
return {
"headers": {
"Authorization": "Token " + key["APITOKEN"],
}
};
}
|
Function convertSheet2Json
Warning
it’s recommended that the function be renamed
-
convertSheet2Json()¶ The function converts data on ALLDATA sheet to JSON
- Returns
{Object) JSON data
1 2 3 4 5 6 7 8 9 10 11 12 13 14 15 16 17 18 | function convertSheet2Json() {
/*idx {string } - year*/
var idx = key["idx"];
var alldatasheet = SpreadsheetApp.openById(idx).getSheetByName("ALLDATA");
var data = alldatasheet.getRange(1, 1, alldatasheet.getLastRow(), alldatasheet.getLastColumn()).getValues();
var titleColumns = data[0];
var jsonArray = [];
for (var i = 1; i < data.length; i++) {
var json = [[]];
for (var j = 0; j < titleColumns.length; j++) {
json[titleColumns[j]] = data[i][j];
}
jsonArray.push(json);
}
return jsonArray;
}
|
Function getAllData
-
getAllData(fcountry, jsonData)¶ The function improts data from Kobo, syncronises, harmonises, calcilates the denepdency ratio and filter
- Arguments
fcountry (array) – country name
jsonData (array) – data from Kobotoolbox
1 2 3 4 5 6 7 8 9 10 11 12 13 14 15 16 17 18 19 20 21 22 23 24 25 26 27 28 29 30 31 32 33 34 35 36 37 38 39 40 41 42 | function getAllData(fcountry, jsonData) {
/*idx {string } - year*/
var idx = key["idx"];
var sst = SpreadsheetApp.openById(idx);
var parametor = sst.getSheetByName("PARAMATOR");
var DATAID = parametor.getRange(2, 3).getValue();
/*para {Object} - get the ORIGINALDATA sheet */
var originaldatasheet = sst.getSheetByName("ORIGINALDATA");
var LC = originaldatasheet.getLastColumn();
var LR = originaldatasheet.getLastRow();
var header = originaldatasheet.getRange(1, 1, 1, LC).getValues();
var indexc = header[0].indexOf("_id");
var indexv = originaldatasheet.getRange(1, indexc + 1, LR, 1).getValues();
var indexh = indexv[0].map(function (col, i) {
return indexv.map(function (row) {
return row[i]
});
});
{/*checks the deleted IDS*/
var countd = 0;
/*creating the ID KEY from KOBODATA*/
var indexv2 = [];
indexv2[0] = [];
for (iv = 0; iv < jsonData.length; iv++) {
indexv2[0][iv] = (jsonData[iv]["_id"]);
}
var deleted = originaldatasheet.getRange(1, 1, LR, 1).getValues();
var copy = copyDatasheet(deleted);
for (d = 1; d < indexv.length; d++) {
if (indexv2[0].indexOf(indexv[d][0]) == -1) {
deleted[d][0] = "XDELETED";
countd++;
}
}
compareNewExistData(deleted, copy, originaldatasheet);
}
|
UNIT sheet
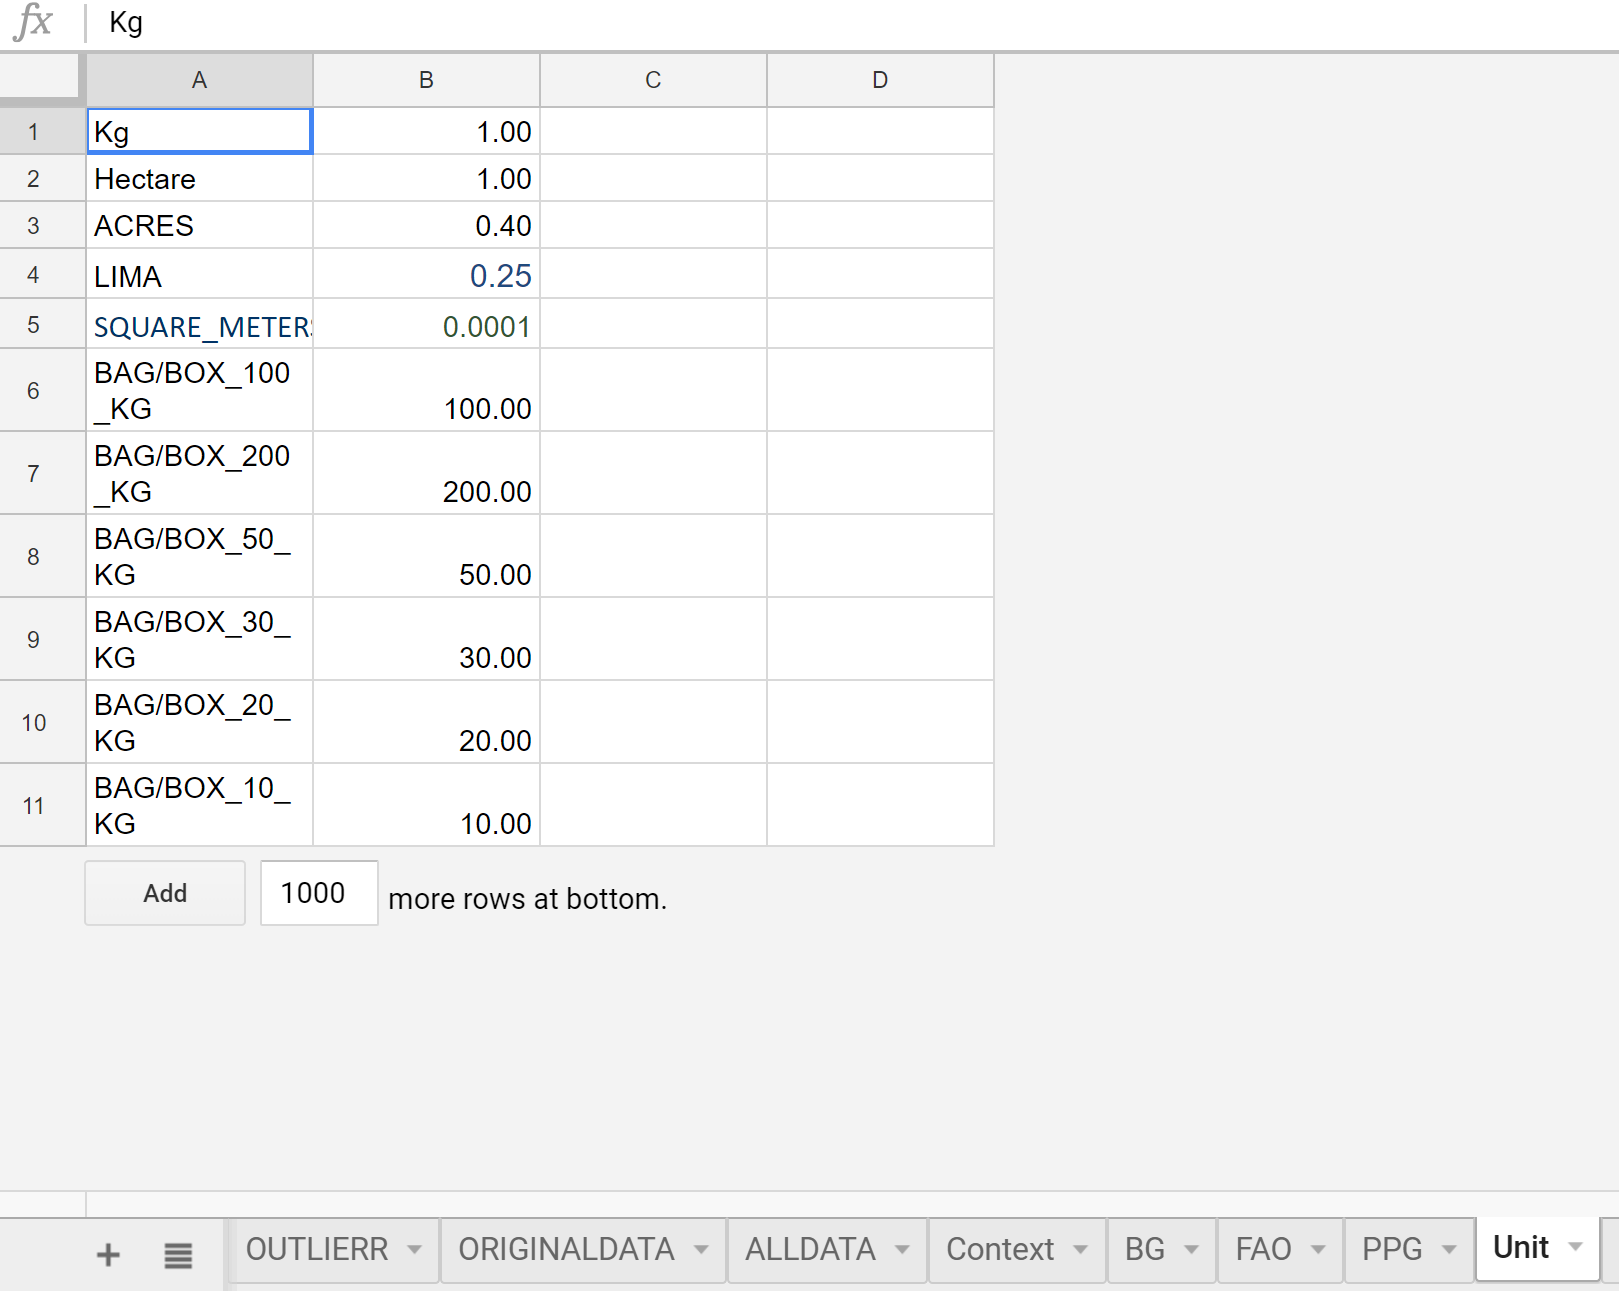
Screenshot of UNIT sheet
1 2 3 4 5 6 7 8 9 10 11 12 13 14 15 16 17 18 19 20 21 22 23 24 25 26 27 28 29 30 31 32 33 34 35 36 37 38 39 40 41 42 43 44 45 46 47 48 49 50 51 52 53 54 55 56 57 58 59 60 61 62 63 64 65 66 67 68 69 70 71 72 73 74 75 76 77 78 79 80 81 82 83 84 85 86 87 88 89 90 91 92 93 94 95 96 97 98 99 100 101 102 103 104 105 106 107 108 109 110 111 112 113 114 115 116 117 118 119 120 121 122 123 124 125 126 127 128 129 130 131 132 | /*Preparing for original calculation*/
/*unitsheet {Object} - get the UNIT sheet */
var unitsheet = sst.getSheetByName("Unit");
var Unit = unitsheet.getRange(1, 1, unitsheet.getLastRow(), unitsheet.getLastColumn()).getValues();
var indexunit = Unit[0].map(function (col, i) {
return Unit.map(function (row) {
return row[i]
});
});
var list3 = []; /*existing unit*/
for (yy = 0; yy < Unit.length; yy++) {
list3.push(Unit[yy][0]);
}
/*Setting column number for unit calculation*/
var c1 = header[0].indexOf("G_OUTPUT1/O1_Crop_Production1/O1_1stCrop");
var c2 = header[0].indexOf("G_OUTPUT1/O1_Crop_Production1/O1_1stCrop_Unit");
var c3 = header[0].indexOf("G_OUTPUT1/O1_Crop_Production1/O1_1stCrop_Land_Unit");
var c4 = header[0].indexOf("Crop1KG");
var c5 = header[0].indexOf("Crop1HA");
var c6 = header[0].indexOf("G_OUTPUT1/O1_Crop_Production1/O1_1stCrop_Product");
var c7 = header[0].indexOf("G_OUTPUT1/O1_Crop_Production1/O1_1stCrop_Land");
var c8 = header[0].indexOf("G_OUTPUT1/O1_Crop_Production2/O1_2ndCrop");
var c9 = header[0].indexOf("G_OUTPUT1/O1_Crop_Production2/O1_2ndCrop_Unit");
var c10 = header[0].indexOf("G_OUTPUT1/O1_Crop_Production2/O1_2ndCrop_Land_Unit");
var c11 = header[0].indexOf("Crop2KG");
var c12 = header[0].indexOf("Crop2HA");
var c13 = header[0].indexOf("G_OUTPUT1/O1_Crop_Production2/O1_2ndCrop_Product");
var c14 = header[0].indexOf("G_OUTPUT1/O1_Crop_Production2/O1_2ndCrop_Land");
/*main loop*/
var newdata = [];
/*data count*/
var y = 0;
var cx = 0;
var finish = 0;
for (i = 0; i < jsonData.length; i++) {
/*Skip if already exists*/
if (indexh[0].indexOf(parseInt(jsonData[i]["_id"])) > -1) { continue; }
/*add a new data*/
newdata[y] = new Array();
for (ii = 0; ii < LC; ii++) {
if (jsonData[i][header[0][ii]] != null) {
newdata[y][ii] = jsonData[i][header[0][ii]];
}else if (jsonData[i][header[0][ii].replace("_001", "")] != null) {
newdata[y][ii] = jsonData[i][header[0][ii].replace("_001", "")];
} else {
newdata[y][ii] = "";
}
}
/*original caluclation with local unit*/
if (newdata[y][c1] != "" && newdata[y][c1] != "NA") {
cx = 0;
if (list3.indexOf(newdata[y][c2].toString()) == -1) {
cx = 1;
}
if (list3.indexOf(newdata[y][c3].toString()) == -1) {
cx = 1;
}
/* CROP 1 KG HA COLUMN ADD*/
newdata[y][c4] = "";
newdata[y][c5] = "";
if (cx == 0) {
var ckg1 = indexunit[0].indexOf(newdata[y][c2]);
var cha1 = indexunit[0].indexOf(newdata[y][c3]);
if (ckg1 > -1) {
newdata[y][c4] = newdata[y][c6] * indexunit[1][ckg1];
}
if (cha1 > -1) {
newdata[y][c5] = newdata[y][c7] * indexunit[1][cha1];
}
}
}
if (newdata[y][c8] != "" && newdata[y][c8] != "NA") {
cx = 0;
if (list3.indexOf(newdata[y][c9].toString()) == -1) {
cx = 1;
}
if (list3.indexOf(newdata[y][c10].toString()) == -1) {
cx = 1;
}
newdata[y][c11] = "";
newdata[y][c12] = "";
if (cx == 0) {
var ckg2 = indexunit[0].indexOf(newdata[y][c9]);
var cha2 = indexunit[0].indexOf(newdata[y][c10]);
if (ckg2 > -1) {
newdata[y][c11] = newdata[y][c13] * indexunit[1][ckg2];
}
if (cha2 > -1) {
newdata[y][c12] = newdata[y][c14] * indexunit[1][cha2]
}
}
}
y++;
}
if (y > 0) { originaldatasheet.getRange(originaldatasheet.getLastRow() + 1, 1, newdata.length, LC).setValues(newdata); }
/*Delte the deleted rows at once*/
{
if (countd > 0) {
originaldatasheet.getRange(2, 1, originaldatasheet.getLastRow() - 1, originaldatasheet.getLastColumn()).sort(1);
originaldatasheet.deleteRows(originaldatasheet.getLastRow() + 1 - countd, countd);
}
}
if (finish == 0) {
updateLog("BS Analysis Sheet updated No.2 (New Data in Kobo checked)");
return 1;
}
else {
/*Task status is STEPPED*/
return 4;
|
Function syncroLHsHarmonization
-
syncroLHsHarmonization(year, formid)¶ The function synchronizes the harmonization process. Copy any new primary data from the ORIGINALDATA sheet to the ALLDATA sheet 1) calculate dependency ratio, 2) checks standard names of crops, animals and unit conversion rate, 3) recalculate the KG and HA of crops 1 and 2, 4) determine the status of data (The system set the limit of 1,000 data per task to keep the duration of each task within 1 minute (as a safeguard against max 5 minutes limit of GAS function). This task will be repeated (STEPPED) until all the new data are pulled and saved.)
- Arguments
year (string) – current year
formid (string) – id of the form

The block-diagram of syncroLHsHarmonization function
1 2 3 4 5 6 7 8 9 10 11 12 13 14 15 16 17 18 19 20 21 22 23 24 25 26 27 28 29 30 31 32 33 34 35 36 37 38 39 40 41 42 43 44 45 46 47 48 49 50 51 52 53 54 55 56 57 58 59 60 61 62 63 64 65 66 67 68 69 70 71 72 73 74 75 76 77 78 79 80 81 82 83 84 85 86 87 88 89 90 91 92 93 94 95 96 97 98 99 100 101 102 103 104 105 106 107 108 109 110 111 112 113 114 115 116 117 118 119 120 121 122 123 124 125 126 127 128 129 130 131 132 133 134 135 136 137 138 139 140 141 142 143 144 145 146 147 148 149 150 151 152 153 154 155 156 157 158 159 160 161 162 163 164 165 166 167 168 169 170 171 172 173 174 175 176 177 178 179 180 181 182 183 184 185 186 187 188 189 190 191 192 193 194 195 196 197 198 199 200 201 202 203 204 205 206 207 208 209 210 211 212 213 214 215 216 217 218 219 220 221 222 223 224 225 226 227 228 229 230 231 232 233 234 235 236 237 238 239 240 241 242 243 244 245 246 247 248 249 250 251 252 253 254 255 256 257 258 259 260 261 262 263 264 265 266 267 268 269 270 271 272 273 274 275 276 277 278 279 280 281 282 283 284 285 286 287 288 289 290 291 292 293 294 295 296 297 298 299 300 301 302 303 304 305 306 307 308 309 310 311 312 313 314 315 316 317 318 319 320 321 322 323 324 325 326 327 328 329 330 331 | function syncroLHsHarmonization() {
/*idx {string } - year*/
var idx = key["idx"];
var sst = SpreadsheetApp.openById(idx);
var originaldatasheet = sst.getSheetByName("ORIGINALDATA");
var alldatasheet = sst.getSheetByName("ALLDATA");
try { alldatasheet.getFilter().remove(); } catch (e) { }
var humsheet = sst.getSheetByName("HAM");
var unitsheet = sst.getSheetByName("Unit");
var LCO = originaldatasheet.getLastColumn();
var LRO = originaldatasheet.getLastRow();
var LCD = alldatasheet.getLastColumn();
var LRD = alldatasheet.getLastRow();
var Origin = originaldatasheet.getRange(1, 1, LRO, LCO).getValues();
var Destination = alldatasheet.getRange(1, 1, LRD, LCD).getValues();
/* for dependency preparation*/
var c1 = Destination[0].indexOf("_id");
var c2 = Origin[0].indexOf("_id");
var c3 = Destination[0].indexOf("DEPENDENCY");
var c4 = Destination[0].indexOf("BENEFICIARY_INFO/Contribution_Age_Group/C15_24");
var c5 = Destination[0].indexOf("BENEFICIARY_INFO/Contribution_Age_Group/C25_64");
var c6 = Destination[0].indexOf("BENEFICIARY_INFO/HH_Age_Group/A14_or_less");
var c7 = Destination[0].indexOf("BENEFICIARY_INFO/Contribution_Age_Group/C65_or_more");
/*for harmonise*/
var Harmonise = humsheet.getRange(1, 1, humsheet.getLastRow(), 2).getValues();
var Unit = unitsheet.getRange(1, 1, unitsheet.getLastRow(), unitsheet.getLastColumn()).getValues();
var list = []; /*storing new names*/
var list4 = []; /*storing new unit*/
var list2 = []; /*existing names*/
var list3 = []; /*existing unit*/
var c = 0;
var a = 0;
var cc1 = Destination[0].indexOf("DATA_CLEANED");
var cc2 = Destination[0].indexOf("G_OUTPUT1/O1_Crop_Production1/O1_1stCrop");
var cc3 = Destination[0].indexOf("G_OUTPUT1/O1_Crop_Production1/O1_1stCrop_Other");
var cc4 = Destination[0].indexOf("G_OUTPUT1/O1_Crop_Production1/O1_1stCrop_Unit");
var cc5 = Destination[0].indexOf("G_OUTPUT1/O1_Crop_Production1/O1_1stCrop_Land_Unit");
var cc6 = Destination[0].indexOf("G_OUTPUT1/O1_Crop_Production1/O1_1stCrop_Product");
var cc7 = Destination[0].indexOf("G_OUTPUT1/O1_Crop_Production1/O1_1stCrop_Land");
var cc8 = Destination[0].indexOf("G_OUTPUT1/O1_Crop_Production2/O1_2ndCrop");
var cc9 = Destination[0].indexOf("G_OUTPUT1/O1_Crop_Production2/O1_2ndCrop_Other");
var cc10 = Destination[0].indexOf("G_OUTPUT1/O1_Crop_Production2/O1_2ndCrop_Unit");
var cc11 = Destination[0].indexOf("G_OUTPUT1/O1_Crop_Production2/O1_2ndCrop_Land_Unit");
var cc12 = Destination[0].indexOf("G_OUTPUT1/O1_Crop_Production2/O1_2ndCrop_Product");
var cc13 = Destination[0].indexOf("G_OUTPUT1/O1_Crop_Production2/O1_2ndCrop_Land");
var cc14 = Destination[0].indexOf("G_OUTPUT1/O1_Animal_Production/Animal1");
var cc15 = Destination[0].indexOf("G_OUTPUT1/O1_Animal_Production/Animal2");
var c144 = Destination[0].indexOf("G_OUTPUT1/O1_Animal_Production/CV");
var c155 = Destination[0].indexOf("G_OUTPUT1/O1_Animal_Production/CV2");
var cc16 = Destination[0].indexOf("Crop1KG");
var cc17 = Destination[0].indexOf("Crop1HA");
var cc18 = Destination[0].indexOf("Crop2KG");
var cc19 = Destination[0].indexOf("Crop2HA");
for (y = 0; y < Harmonise.length; y++) {
for (x = 0; x < 2; x++) {
list2.push(String(Harmonise[y][x]));
}
}
for (yy = 0; yy < Unit.length; yy++) {
list3.push(Unit[yy][0]);
}
var indexham = Harmonise[0].map(function (col, i) {
return Harmonise.map(function (row) {
return row[i]
});
});
var indexunit = Unit[0].map(function (col, i) {
return Unit.map(function (row) {
return row[i]
});
});
/*Indexing for faster search*/
var indexv = alldatasheet.getRange(1, c1 + 1, alldatasheet.getLastRow(), 1).getValues();
var indexh = indexv[0].map(function (col, i) {
return indexv.map(function (row) {
return row[i]
});
});
{/*Checking deleted IDs*/
var countd = 0;
/*creating the ID KEY from KOBODATA*/
var indexv2 = [];
indexv2[0] = [];
for (iv = 0; iv < Origin.length; iv++) {
indexv2[0][iv] = Origin[iv][c2];
}
/*Get the first column*/
var deleted = alldatasheet.getRange(1, 1, LRD, 1).getValues();
var copy = copyDatasheet(deleted);
for (d = 1; d < Destination.length; d++) {
if (indexv2[0].indexOf(Destination[d][c1]) == -1) {
deleted[d][0] = "XDELETED";
countd++;
}
}
compareNewExistData(deleted, copy, alldatasheet);
}
{ /*New data integrated*/
var newdata = [];
var y = 0;//DATA COUNT
var finish = 0;
/*Main loop*/
for (i = 1; i < LRO; i++) {
/*Skip if already exists*/
if (indexh[0].indexOf(parseInt(Origin[i][c2])) > -1) { continue; }
newdata[y] = new Array();
newdata[y] = Origin[i].concat();
/*Dependency calculation*/
var d = 0;
var den = newdata[y][c4] + newdata[y][c5];
if (den > 0) {
d = (newdata[y][c6] + newdata[y][c7]) / (newdata[y][c4] + newdata[y][c5]);
}
else {
d = 99;
}
newdata[y][c3] = d;
/*harmonizing for the first time*/
newdata[y][cc1] = "OK";
/*Crop 1*/
if (String(newdata[y][cc2]) != "0" && String(newdata[y][cc2]) != "" && newdata[y][cc2] != "NA") {
a = 0;
c = 0;
/*CROP1 name in HAM list*/
var cr1 = indexham[0].indexOf(newdata[y][cc2].toString());
var cro1 = indexham[0].indexOf(newdata[y][cc3].toString().replace(/(^\s+)|(\s+$)/g, ""));
if (cr1 > -1) {
newdata[y][cc2] = indexham[1][cr1];
newdata[y][cc3] = "";
a = 1;
} else if (newdata[y][cc2] == "Other" && cro1 > -1) {
newdata[y][cc2] = indexham[1][cro1];
a = 1;
if (indexham[1][cro1] != "Other") {
newdata[y][cc3] = "";
}
}
/*IF NO, add it to the list and change OK to crop name*/
if (a == 0) {
if (list2.indexOf(newdata[y][cc2].toString().replace(/(^\s+)|(\s+$)/g, "")) == -1) {
newdata[y][cc1] = "CROP NAMES";
}
if (newdata[y][cc2] == "Other" && list2.indexOf(newdata[y][cc3].toString().replace(/(^\s+)|(\s+$)/g, "")) == -1) {
newdata[y][cc1] = "CROP NAMES";
}
}
/*IF UNIT doesn't exist, change OK to UNIT*/
if (newdata[y][cc2] != "" && list3.indexOf(newdata[y][cc4].toString()) == -1) {
newdata[y][cc1] = "UNIT";
c = 1;
}
if (newdata[y][cc2] != "" && list3.indexOf(newdata[y][cc5].toString()) == -1) {
newdata[y][cc1] = "UNIT";
}
/* Crop 1 KG HA column Add*/
newdata[y][cc16] = "";
newdata[y][cc17] = "";
if (c == 0) {
var ckg1 = indexunit[0].indexOf(newdata[y][cc4]);
var cha1 = indexunit[0].indexOf(newdata[y][cc5]);
if (ckg1 > -1) {
newdata[y][cc16] = newdata[y][cc6] * indexunit[1][ckg1];
}
if (cha1 > -1) {
newdata[y][cc17] = newdata[y][cc7] * indexunit[1][cha1];
}
}
}
/*CROP 2*/
if (String(newdata[y][cc8]) != "" && newdata[y][cc8] != "NA") {
a = 0;
c = 0;
/*CROP2 name in HAM list?*/
var cr2 = indexham[0].indexOf(newdata[y][cc8].toString());
var cro2 = indexham[0].indexOf(newdata[y][cc9].toString().replace(/(^\s+)|(\s+$)/g, ""));
if (cr2 > -1) {
newdata[y][cc8] = indexham[1][cr2];
newdata[y][cc9] = "";
a = 1;
c = 0;
} else if (newdata[y][cc8] == "Other" && cro2 > -1) {
newdata[y][cc8] = indexham[1][cro2];
a = 1;
if (indexham[1][cro2] != "Other") {
newdata[y][cc9] = "";
}
}
/*If no, add it to the list and change OK to crop name*/
if (a == 0) {
if (list2.indexOf(newdata[y][cc8].toString().replace(/(^\s+)|(\s+$)/g, "")) == -1) {
newdata[y][cc1] = "CROP NAMES";
}
if (newdata[y][cc8] == "Other" && list2.indexOf(newdata[y][cc9].toString().replace(/(^\s+)|(\s+$)/g, "")) == -1) {
newdata[y][cc1] = "CROP NAMES";
}
}
/* IF UNIT doesn't exist, change ok to unit*/
if (newdata[y][cc8] != "" && list3.indexOf(newdata[y][cc10].toString()) == -1) {
newdata[y][cc1] = "UNIT";
c = 1;
}
if (newdata[y][cc8] != "" && list3.indexOf(newdata[y][cc11].toString()) == -1) {
newdata[y][cc1] = "UNIT";
c = 1;
}
/* CROP 2 KG HA column Add*/
newdata[y][cc18] = "";
newdata[y][cc19] = "";
if (c == 0) {
var ckg2 = indexunit[0].indexOf(newdata[y][cc10]);
var cha2 = indexunit[0].indexOf(newdata[y][cc11]);
if (ckg2 > -1) {
newdata[y][cc18] = newdata[y][cc12] * indexunit[1][ckg2];
}
if (cha2 > -1) {
newdata[y][cc19] = newdata[y][cc13] * indexunit[1][cha2];
}
}
}
/*Animal1*/
if (String(newdata[y][c144]) != "") {
a = 0;
var ani1 = indexham[0].indexOf(newdata[y][c144].toString().replace(/(^\s+)|(\s+$)/g, ""));
if (ani1 > -1) {
newdata[y][cc14] = indexham[1][ani1];
a = 1;
}
if (a == 0) {
if (list2.indexOf(newdata[y][c144].toString().replace(/(^\s+)|(\s+$)/g, "")) == -1) {
newdata[y][cc1] = "ANIMAL NAMES";
}
}
}
/*Animal2*/
if (String(newdata[y][c155]) != "") {
a = 0;
var ani2 = indexham[0].indexOf(newdata[y][c155].toString().replace(/(^\s+)|(\s+$)/g, ""));
if (ani2 > -1) {
newdata[y][cc15] = indexham[1][ani2];
a = 1;
}
if (a == 0) {
if (list2.indexOf(newdata[y][cc15].toString().replace(/(^\s+)|(\s+$)/g, "")) == -1) {
newdata[y][cc1] = "ANIMAL NAMES";
}
}
}
y++;
}
}
if (y > 0) { alldatasheet.getRange(alldatasheet.getLastRow() + 1, 1, newdata.length, LCD).setValues(newdata); }
{/*Delete the deleted rows at once*/
if (countd > 0) {
alldatasheet.getRange(2, 1, alldatasheet.getLastRow() - 1, alldatasheet.getLastColumn()).sort(1);
alldatasheet.deleteRows(alldatasheet.getLastRow() + 1 - countd, countd);
}
}
if (finish == 0) {
updateLog("BS Analysis Sheet updated No.3 (New Data from Kobo syncronised)");
return 1;
}
else {
/*Task status is STEPPED*/
return 4;
}
}
|
Function harmoniseData
-
harmoniseData(EOF, formdataid)¶ The function harmonises the names of crop/animals and conversion rate for all the data (new and old) again
- Arguments
EOF (string) – ENDLINE ON/OFF
formdataid (string) – dataid
1 2 3 4 5 6 7 8 9 10 11 12 13 14 15 16 17 18 19 20 21 22 23 24 25 26 27 28 29 30 31 32 33 34 35 36 37 38 39 40 41 42 43 44 45 46 47 48 49 50 51 52 53 54 55 56 57 58 59 60 61 62 63 64 65 66 67 68 69 70 71 72 73 74 75 76 77 78 79 80 81 82 83 84 85 86 87 88 89 90 91 92 93 94 95 96 97 98 99 100 101 102 103 104 105 106 107 108 109 110 111 112 113 114 115 116 117 118 119 120 121 122 123 124 125 126 127 128 129 130 131 132 133 134 135 136 137 138 139 140 141 142 143 144 145 146 147 148 149 150 151 152 153 154 155 156 157 158 159 160 161 162 163 164 165 166 167 168 169 170 171 172 173 174 175 176 177 178 179 180 181 182 183 184 185 186 187 188 189 190 191 192 193 194 195 196 197 198 199 200 201 202 203 204 205 206 207 208 209 210 211 212 213 214 215 216 217 218 219 220 221 222 223 224 225 226 227 228 229 230 231 232 233 234 235 236 237 238 239 240 241 242 243 244 245 246 247 248 249 250 251 252 253 254 255 256 257 258 259 260 261 262 263 264 265 266 267 268 269 270 271 272 273 274 275 276 277 278 279 280 281 282 283 284 285 286 287 288 289 290 291 292 293 294 295 296 297 298 299 300 301 302 303 304 305 306 307 308 309 | function harmoniseData(EOF, formdataid) {
/*idx {string } - year*/
var idx = key["idx"];
var sst = SpreadsheetApp.openById(idx);
var alldatasheet = sst.getSheetByName("ALLDATA");
var humsheet = sst.getSheetByName("HAM");
var unitsheet = sst.getSheetByName("Unit");
var LRD = alldatasheet.getLastRow();
var Destination = alldatasheet.getRange(1, 1, LRD, alldatasheet.getLastColumn()).getValues();
var copy = copyDatasheet(Destination);
var Harmonise = humsheet.getRange(1, 1, humsheet.getLastRow(), 2).getValues();
var Unit = unitsheet.getRange(1, 1, unitsheet.getLastRow(), unitsheet.getLastColumn()).getValues();
var list = []; /*storing new names*/
var list4 = []; /*storing new unit*/
var list2 = []; /*existing names*/
var list3 = []; /*existing unit*/
var c = 0;
var a = 0;
var c1 = Destination[0].indexOf("DATA_CLEANED");
var c2 = Destination[0].indexOf("G_OUTPUT1/O1_Crop_Production1/O1_1stCrop");
var c3 = Destination[0].indexOf("G_OUTPUT1/O1_Crop_Production1/O1_1stCrop_Other");
var c4 = Destination[0].indexOf("G_OUTPUT1/O1_Crop_Production1/O1_1stCrop_Unit");
var c5 = Destination[0].indexOf("G_OUTPUT1/O1_Crop_Production1/O1_1stCrop_Land_Unit");
var c6 = Destination[0].indexOf("G_OUTPUT1/O1_Crop_Production1/O1_1stCrop_Product");
var c7 = Destination[0].indexOf("G_OUTPUT1/O1_Crop_Production1/O1_1stCrop_Land");
var c8 = Destination[0].indexOf("G_OUTPUT1/O1_Crop_Production2/O1_2ndCrop");
var c9 = Destination[0].indexOf("G_OUTPUT1/O1_Crop_Production2/O1_2ndCrop_Other");
var c10 = Destination[0].indexOf("G_OUTPUT1/O1_Crop_Production2/O1_2ndCrop_Unit");
var c11 = Destination[0].indexOf("G_OUTPUT1/O1_Crop_Production2/O1_2ndCrop_Land_Unit");
var c12 = Destination[0].indexOf("G_OUTPUT1/O1_Crop_Production2/O1_2ndCrop_Product");
var c13 = Destination[0].indexOf("G_OUTPUT1/O1_Crop_Production2/O1_2ndCrop_Land");
var c14 = Destination[0].indexOf("G_OUTPUT1/O1_Animal_Production/Animal1");
var c15 = Destination[0].indexOf("G_OUTPUT1/O1_Animal_Production/Animal2");
var c144 = Destination[0].indexOf("G_OUTPUT1/O1_Animal_Production/CV");
var c155 = Destination[0].indexOf("G_OUTPUT1/O1_Animal_Production/CV2");
var c16 = Destination[0].indexOf("Crop1KG");
var c17 = Destination[0].indexOf("Crop1HA");
var c18 = Destination[0].indexOf("Crop2KG");
var c19 = Destination[0].indexOf("Crop2HA");
var c20 = Destination[0].indexOf("PARTNER_INFO/BE");
var c21 = Destination[0].indexOf("TemplateID");
for (y = 0; y < Harmonise.length; y++) {
for (x = 0; x < 2; x++) {
list2.push(String(Harmonise[y][x]));
}
}
for (yy = 0; yy < Unit.length; yy++) {
list3.push(Unit[yy][0]);
}
/*TRANSPOSING FOR INDEXING*/
var indexham = Harmonise[0].map(function (col, i) {
return Harmonise.map(function (row) {
return row[i]
});
});
var indexunit = Unit[0].map(function (col, i) {
return Unit.map(function (row) {
return row[i]
});
});
/*Status of ENDLINE (ON/OFF)*/
if (EOF == "TRUE") {
for (i = 1; i < LRD; i++) {
if (Destination[i][c1] == "OFF" && Destination[i][c21]==formdataid) {
Destination[i][c1] = "";
}
}
}
if (EOF == "FALSE") {
for (i = 1; i < LRD; i++) {
if (Destination[i][c20] = "Endline" && Destination[i][c21]==formdataid) {
Destination[i][c1] = "OFF";
}
}
}
/*Main LOOP*/
for (i = 1; i < LRD; i++) {
if (Destination[i][c1] == "OK") {
continue;
}
Destination[i][c1] = "OK";
/*CROP 1*/
if (String(Destination[i][c2]) != "0" && String(Destination[i][c2]) != "" && Destination[i][c2] != "NA") {
a = 0;
c = 0;
/*CROP1 NAME IN HAM LIST*/
var cr1 = indexham[0].indexOf(Destination[i][c2]);
var cro1 = indexham[0].indexOf(Destination[i][c3].toString().replace(/(^\s+)|(\s+$)/g, ""));
if (cr1 > -1) {
Destination[i][c2] = indexham[1][cr1];
Destination[i][c3] = "";
a = 1;
} else if (Destination[i][c2] == "Other" && cro1 > -1) {
Destination[i][c2] = indexham[1][cro1];
a = 1;
if (indexham[1][cro1] != "Other") {
Destination[i][c3] = "";
}
}
/*If NO, Add it to the list and check ok to CROP NAME*/
if (a == 0) {
if (list2.indexOf(Destination[i][c2].toString().replace(/(^\s+)|(\s+$)/g, "")) == -1) {
if (list.indexOf(Destination[i][c2].toString().replace(/(^\s+)|(\s+$)/g, "")) == -1) {
list.push(Destination[i][c2].toString().replace(/(^\s+)|(\s+$)/g, ""));
}
Destination[i][c1] = "CROP NAMES";
}
if (Destination[i][c2] == "Other" && list2.indexOf(Destination[i][c3].toString().replace(/(^\s+)|(\s+$)/g, "")) == -1) {
if (list.indexOf(Destination[i][c3].toString().replace(/(^\s+)|(\s+$)/g, "")) == -1) {
list.push(Destination[i][c3].toString().replace(/(^\s+)|(\s+$)/g, ""));
}
Destination[i][c1] = "CROP NAMES";
}
}
/*If Unit doesn't exist, change ok to UNIT*/
if (list3.indexOf(Destination[i][c4].toString()) == -1) {
Destination[i][c1] = "UNIT";
c = 1;
if (list4.indexOf(Destination[i][c4].toString()) == -1) {
list4.push(Destination[i][c4].toString());
}
}
if (list3.indexOf(Destination[i][c5].toString()) == -1) {
Destination[i][c1] = "UNIT";
c = 1;
if (list4.indexOf(Destination[i][c5].toString()) == -1) {
list4.push(Destination[i][c5].toString());
}
}
/* CROP 1 KG HA, add new column*/
Destination[i][c16] = "";
Destination[i][c17] = "";
if (c == 0) {
var ckg1 = indexunit[0].indexOf(Destination[i][c4]);
var cha1 = indexunit[0].indexOf(Destination[i][c5]);
if (ckg1 > -1) {
Destination[i][c16] = Destination[i][c6] * indexunit[1][ckg1];
}
if (cha1 > -1) {
Destination[i][c17] = Destination[i][c7] * indexunit[1][cha1];
}
}
}
/*CROP 2*/
if (String(Destination[i][c8]) != "" && Destination[i][c8] != "NA") {
a = 0;
c = 0;
/*CROP2 name in HAM list*/
var cr2 = indexham[0].indexOf(Destination[i][c8]);
var cro2 = indexham[0].indexOf(Destination[i][c9].toString().replace(/(^\s+)|(\s+$)/g, ""));
if (cr2 > -1) {
Destination[i][c8] = indexham[1][cr2];
Destination[i][c9] = "";
a = 1;
c = 0;
} else if (Destination[i][c8] == "Other" && cro2 > -1) {
Destination[i][c8] = indexham[1][cro2];
a = 1;
if (indexham[1][cro2] != "Other") {
Destination[i][c9] = "";
}
}
/*If no, add it to the list and change OK to CROP name*/
if (a == 0) {
if (list2.indexOf(Destination[i][c8].toString().replace(/(^\s+)|(\s+$)/g, "")) == -1) {
if (list.indexOf(Destination[i][c8].toString().replace(/(^\s+)|(\s+$)/g, "")) == -1) {
list.push(Destination[i][c8].toString().replace(/(^\s+)|(\s+$)/g, ""));
}
Destination[i][c1] = "CROP NAMES";
}
if (Destination[i][c8] == "Other" && list2.indexOf(Destination[i][c9].toString().replace(/(^\s+)|(\s+$)/g, "")) == -1) {
if (list.indexOf(Destination[i][c9].toString().replace(/(^\s+)|(\s+$)/g, "")) == -1) {
list.push(Destination[i][c9].toString().replace(/(^\s+)|(\s+$)/g, ""));
}
Destination[i][c1] = "CROP NAMES";
}
}
/*if unit doesn't exist, change OK to UNIT*/
if (list3.indexOf(Destination[i][c10].toString()) == -1) {
Destination[i][c1] = "UNIT";
c = 1;
if (list4.indexOf(Destination[i][c10].toString()) == -1) {
list4.push(Destination[i][c10].toString());
}
}
if (list3.indexOf(Destination[i][c11].toString()) == -1) {
Destination[i][c1] = "UNIT";
c = 1;
if (list4.indexOf(Destination[i][c11].toString()) == -1) {
list4.push(Destination[i][c11].toString());
}
}
/* CROP 2 KG HA, add new column*/
Destination[i][c18] = "";
Destination[i][c19] = "";
if (c == 0) {
var ckg2 = indexunit[0].indexOf(Destination[i][c10]);
var cha2 = indexunit[0].indexOf(Destination[i][c11]);
if (ckg2 > -1) {
Destination[i][c18] = Destination[i][c12] * indexunit[1][ckg2];
}
if (cha2 > -1) {
Destination[i][c19] = Destination[i][c13] * indexunit[1][cha2];
}
}
}
/*ANIMAL1*/
if (String(Destination[i][c144]) != "") {
a = 0;
var ani1 = indexham[0].indexOf(Destination[i][c144].toString().replace(/(^\s+)|(\s+$)/g, ""));
if (ani1 > -1) {
Destination[i][c14] = indexham[1][ani1];
a = 1;
}
if (a == 0) {
if (list2.indexOf(Destination[i][c144].toString().replace(/(^\s+)|(\s+$)/g, "")) == -1) {
if (list.indexOf(Destination[i][c144].toString().replace(/(^\s+)|(\s+$)/g, "")) == -1) {
list.push(Destination[i][c144].toString().replace(/(^\s+)|(\s+$)/g, ""));
}
Destination[i][c1] = "ANIMAL NAMES";
}
}
}
/*ANIMAL2*/
if (String(Destination[i][c155]) != "") {
a = 0;
var ani2 = indexham[0].indexOf(Destination[i][c155].toString().replace(/(^\s+)|(\s+$)/g, ""));
if (ani2 > -1) {
Destination[i][c15] = indexham[1][ani2];
a = 1;
}
if (a == 0) {
if (list2.indexOf(Destination[i][c155].toString().replace(/(^\s+)|(\s+$)/g, "")) == -1) {
if (list.indexOf(Destination[i][c155].toString().replace(/(^\s+)|(\s+$)/g, "")) == -1) {
list.push(Destination[i][c155].toString().replace(/(^\s+)|(\s+$)/g, ""));
}
Destination[i][c1] = "ANIMAL NAMES";
}
}
}
}
compareNewExistData(Destination, copy, alldatasheet);
humsheet.getRange(1, 4, humsheet.getLastRow(), 1).clear();
var y = 1;
for (i = 0; i < list.length; i++) {
a = 0;
for (ii = 0; ii < Harmonise.length; ii++) {
if (Harmonise[ii][1] == list[i]) {
a = 1;
}
}
if (a == 0) {
humsheet.getRange(y, 4).setValue(list[i]);
y++;
}
}
unitsheet.getRange(1, 4, unitsheet.getLastRow(), 1).clear();
for (i4 = 0; i4 < list4.length; i4++) {
unitsheet.getRange(i4 + 1, 4).setValue(list4[i4]);
}
updateLog("BS Analysis Sheet updated No.4 (Harmonised)");
return 1;
}
|
Function datafilter
Warning
it’s recommended that the function be renamed
-
datafilter(cy, fy)¶ The function formats the filter fields on Report sheet
1 2 3 4 5 6 7 8 9 10 11 12 13 14 15 16 | function datafilter(cy, fy) {
var idx = key["idx"];
var sst = SpreadsheetApp.openById(idx);
var sheet = sst.getSheetByName("Report");
var f = [[]];
for (i = 0; i < cy - datay; i++) {
f[i] = new Array();
f[i][0] = fy;
}
sheet.getRange(datay + 1, 1, cy - datay, 1).setValues(f);
sheet.getRange(datay + 1, 1, cy - datay, 1).setFontColor("white");
datay = cy;
}
}
|
Function calculateOutlier
-
calculateOutlier()¶ The function calculates the outlier
OUTLIERR sheet
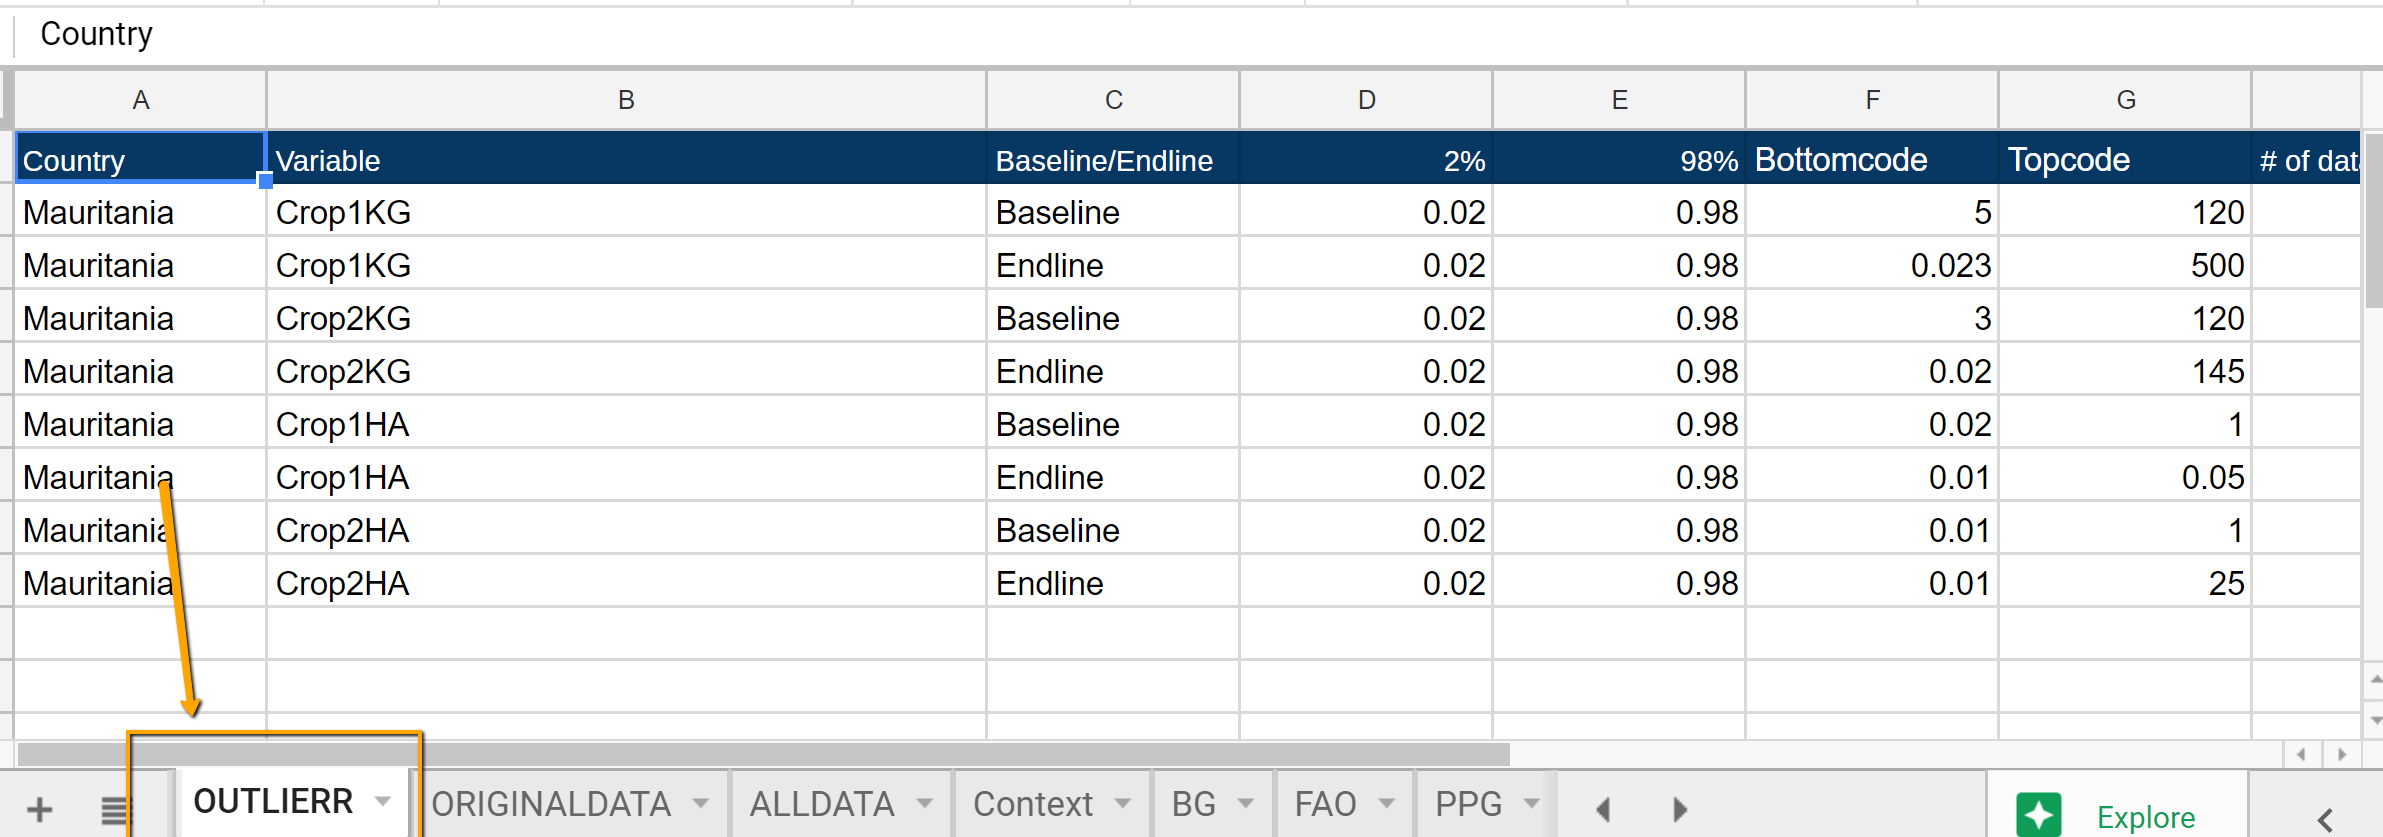
Screenshot of OUTLIERR sheet
OUTLIERV sheet
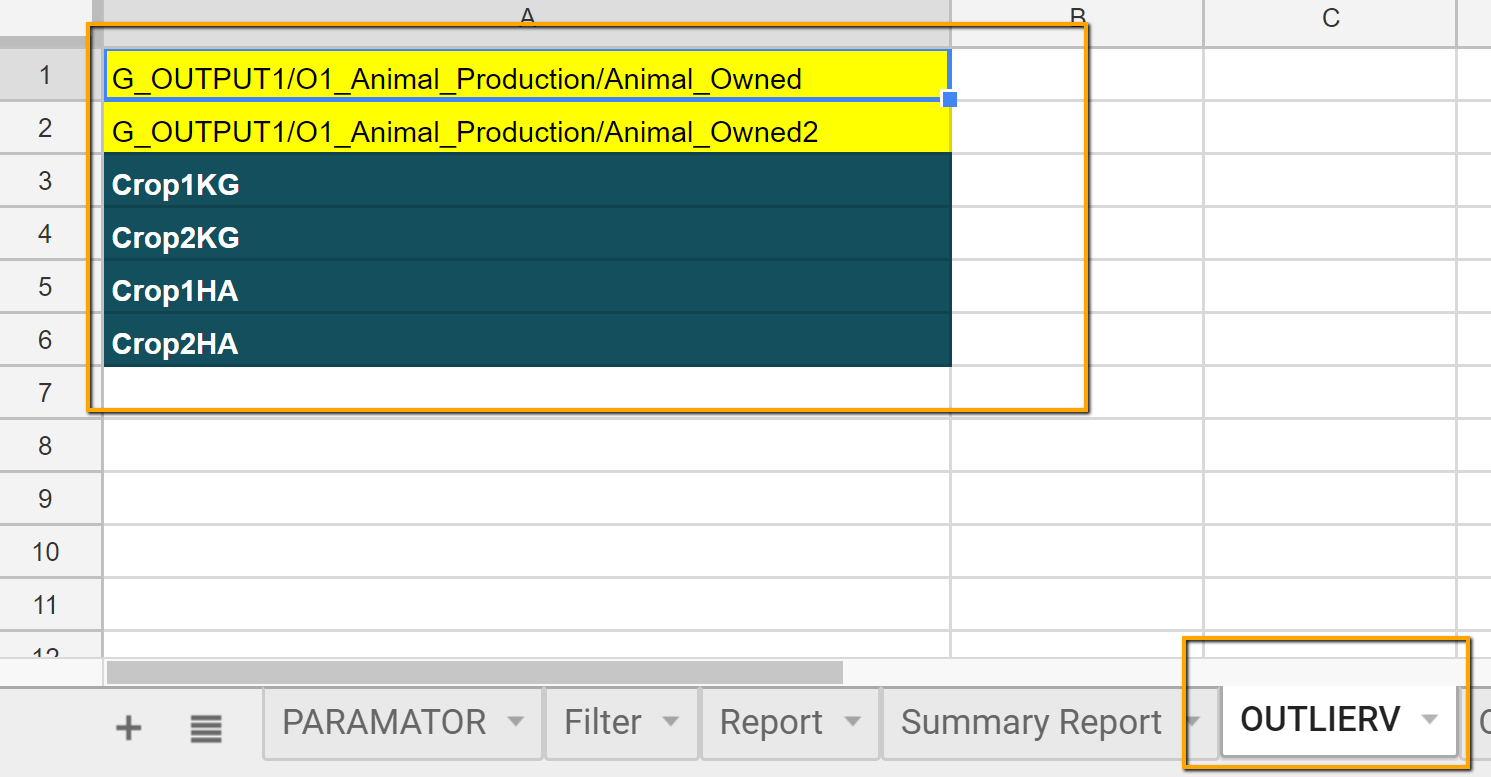
Screenshot of OUTLIERV sheet
1 2 3 4 5 6 7 8 9 10 11 12 13 14 15 16 17 18 19 20 21 22 23 24 25 26 27 28 29 30 31 32 33 34 35 36 37 38 39 40 41 42 43 44 45 46 47 48 49 50 51 52 53 54 55 56 57 58 59 60 61 62 63 64 65 66 67 68 69 70 71 72 73 74 75 76 77 78 79 80 81 82 83 84 85 86 87 88 89 90 91 92 93 94 95 96 97 98 99 100 101 102 103 104 105 106 107 108 109 110 111 112 113 114 115 | function calculateOutlier() {
/*idx {string } - year*/
var idx = key["idx"];
/*sst {object} - spreadsheet object with the given id [Opens the spreadsheet with the given ID]*/
var sst = SpreadsheetApp.openById(idx);
/*outlierv {type} -the sheet with the given name [OUTLIERV]*/
var outlierv = sst.getSheetByName("OUTLIERV");
/*outlierr {type} -the sheet with the given name [OUTLIERR]*/
var outlierr = sst.getSheetByName("OUTLIERR");
/*ovariables {array} - all the data from OURLIERR*/
var ovariables = outlierv.getRange(1, 1, outlierv.getLastRow(), outlierv.getLastColumn()).getValues();
/*function convert data from OUTLIERV sheet to json [DATA ANALYSIS component]*/
/*odata [array] - Json data*/
var odata = convertDataOutliervToJson();
var result = outlierr.getRange(1, 1, 1, 9).getValues();
var percent = outlierr.getRange(1, 1, outlierr.getLastRow(), 5).getValues();
var ocountry = [];
outlierr.getRange(2, 1, outlierr.getLastRow(), 9).clear();
/*find the country in data (odata)*/
var ii = 0;
for (i = 0; i < odata.length; i++) {
if (ocountry.indexOf(odata[i]["Country"]) == -1) {
ocountry[ii] = odata[i]["Country"];
ii++;
}
}
/*Calculation*/
var b1 = 0,
b2 = 0,
r = 1;
var btomcbl = [];
var btomcel = [];
var topcbl = [];
var topcel = [];
/*data disagregation by country*/
for (c = 0; c < ocountry.length; c++) {
/*data disagregatino by each variable*/
for (v = 0; v < ovariables.length; v++) {
if (ovariables[v] == "Crop1KG" || ovariables[v] == "Crop2KG" || ovariables[v] == "Crop1HA" || ovariables[v] == "Crop2HA") {
/*going thtough all the data*/
for (i = 0; i < odata.length; i++) {//GOING THROUGH ALL DATA FROM THE TOP
if (String(odata[i][String(ovariables[v])]) != "" && odata[i]['Country'] == ocountry[c]) {
if (odata[i]['PARTNER_INFO/BE'] == "Baseline") {
btomcbl.push(parseFloat(odata[i][ovariables[v]]));
b1++;
}
if (odata[i]['PARTNER_INFO/BE'] == "Endline") {
btomcel.push(parseFloat(odata[i][ovariables[v]]));
b2++;
}
}
}
} else {
for (i = 0; i < odata.length; i++) {
if (odata[i][String(ovariables[v])] != "" && odata[i]['Country'] == ocountry[c]) {
if (odata[i]['PARTNER_INFO/BE'] == "Baseline") {
btomcbl.push(parseFloat(odata[i][ovariables[v]]));
b1++;
}
if (odata[i]['PARTNER_INFO/BE'] == "Endline") {
btomcel.push(parseFloat(odata[i][ovariables[v]]));
b2++;
}
}
}
}
btomcbl.sort(function (a, b) {
return a - b;
});
btomcel.sort(function (a, b) {
return a - b;
});
/*bottomcode for baseline*/
var bottompbl = result[0][3];
/*topcode for baseline*/
var toppbl = result[0][4];
/*bottomcode for endline*/
var bottompel = result[0][3];
/*topcode for endline*/
var toppel = result[0][4];
for (j = 0; j < percent.length; j++) {
if (ocountry[c] == percent[j][0] && ovariables[v][0] == percent[j][1] && percent[j][2] == "Baseline") {
bottompbl = percent[j][3];
toppbl = percent[j][4]
};
if (ocountry[c] == percent[j][0] && ovariables[v][0] == percent[j][1] && percent[j][2] == "Endline") {
bottompel = percent[j][3];
toppel = percent[j][4]
};
}
if (btomcbl.length > 0) {
result.push([[ocountry[c]], [ovariables[v][0]], ["Baseline"], bottompbl, toppbl, [btomcbl[Math.ceil(btomcbl.length * bottompbl) - 1]], [btomcbl[Math.floor(btomcbl.length * toppbl)]], [btomcbl.length], [btomcbl.join(',')]]);
}
if (btomcel.length > 0) {
result.push([[ocountry[c]], [ovariables[v][0]], ["Endline"], bottompel, toppel, [btomcel[Math.ceil(btomcel.length * bottompel) - 1]], [btomcel[Math.floor(btomcel.length * toppel)]], [btomcel.length], [btomcel.join(',')]]);
}
btomcbl = [];
btomcel = [];
}
}
outlierr.getRange(1, 1, result.length, 9).setValues(result);
}
|
Function convertDataOutliervToJson
-
convertDataOutliervToJson()¶ The function converts data from OUTLIERV sheet to JSON format, calls from OUTLIERS > outliercalculation
1 2 3 4 5 6 7 8 9 10 11 12 13 14 15 16 17 18 19 20 21 22 23 | function convertDataOutliervToJson() {
/*idx {string } - year*/
var idx = key["idx"];
/*sst {object} - spreadsheet object with the given id [Opens the spreadsheet with the given ID]*/
var sst = SpreadsheetApp.openById(idx);
/*originaldatasheet {type} -the sheet with the given name (ORIGINALDATA)*/
var originaldatasheet = sst.getSheetByName("ORIGINALDATA");
/*data {array} - all the data from ORIGINALDATA sheet*/
var data = originaldatasheet.getRange(1, 1, originaldatasheet.getLastRow(), originaldatasheet.getLastColumn()).getValues();
/*titleColimns */
var titleColumns = data[0];
var jsonArray = [];
for (var i = 1; i < data.length; i++) {
var json = [[]];
for (var j = 0; j < titleColumns.length; j++) {
json[titleColumns[j]] = data[i][j];
}
jsonArray.push(json);
}
return jsonArray;
}
|
Function extractCountryAnalysisNote
-
extractCountryAnalysisNote()¶ The function extracts country analysis note on country_analysis_note sheet
Resetting GLobal Variables
1 2 3 4 5 6 7 8 9 10 11 12 13 14 15 16 17 18 19 20 21 22 23 24 25 26 27 28 29 30 31 32 33 34 35 36 37 38 39 40 41 42 43 44 45 46 47 48 49 50 51 52 53 54 55 56 57 58 59 60 61 62 63 64 65 66 67 68 69 70 71 72 73 74 75 76 77 78 79 80 81 82 83 84 85 86 87 88 89 90 91 92 93 94 95 96 97 98 99 100 101 102 103 104 105 106 107 108 109 110 111 112 113 114 115 116 | function extractCountryAnalysisNote() {
/*Resetting Global Variables*/
{
XX = 1;
YY = 1;
y = 26;
x = 2;
StartDate = "";
EndDate = "";
bgdata;
tn = 1;
endline = 0;
/*Total number of forcibly displaced targeted [OUTPUT1]*/
tpocbene1 = 0;
/*Total number of forcibly displaced targeted [Intervention]*/
tpocbene2 = 0;
/* Total number of forcibly displaced targeted [Title]*/
tpocbene3 = 0
/* Total number of host beneficiaries targeted [Output1]*/
thbene1 = 0;
/*Total number of host beneficiaries targeted [Intervention]*/
thbene2 = 0;
/*Total number of host beneficiaries targeted [Title]*/
thbene3 = 0;
sl = "";
l = "";
/*total number of beneficiaries involved in farming [Sub-Sector]*/
farmingtotal = null;
/*1st Crop*/
zerofarmingtotal = null;
/*total number of livestock owned*/
livestocktotal = null;
/*total number of beneficiaries engaged in fishering*/
fisherytotal = null;
t1 = "";
table = null;
table2 = null;
table3 = null; table4 = null; table5 = null;
totalemployed = 0;
totalemployed2 = 0;
totaloutput = 0;
incomeyear = 0;
incomeseason = 0;
savingyear = 0;
savingseason = 0;
incomeyeard = 0;
incomeseasond = 0;
savingyeard = 0;
savingseasond = 0;
bltotalkg = 0;
bltotalhc = 0;
eltotalkg = 0;
eltotalhc = 0;
blaverageanimal = 0;
blbene = 0;
elaageanimal = 0;
elbene = 0;
selfemployed = 0;
formalemployed = 0;
permanentemployed = 0;
employed612 = 0;
employed12 = 0;
totalfaming = 0;
totallivestock = 0;
totalcropkg = 0;
totalcrophc = 0;
totalaveragelivestock = 0;
totalaveragelivestock2 = 0;
totalcropkg2 = 0;
totalcrophc2 = 0;
totalaveragelivestock2 = 0;
firstcrop = "";
firstcropkg = 0;
firstcrophc = 0;
firstcropratio = 0;
firstcropnational = 0;
secondcrop = "";
secondcropkg = 0;
secondcrophc = 0;
secondcropratio = 0;
secondcropnational = 0;
firstlivestock = "";
firsttotallivestock = 0;
firstaveragelivestock = 0;
fishtotal = 0; fishtotal2;
fishbene = 0;
fishbene2 = 0;
totaloutputbl = 0;
totaloutputel = 0;
budget1 = 0;
budget2 = 0;
budget3 = 0;
pbudget = 0;
/*PoC Benefeciary*/
pocbene1 = 0;
pocbene2 = 0;
pocbene3 = 0
/*Host Benefeciary*/
hbene1 = 0;
hbene2 = 0;
hbene3 = 0;;
camps;
cnames = "";
totalbudget = 0;
/*total population*/
totalpoc = 0;
totalhost = 0;
/*number of partners*/
npartner = 0;
int1 = "";
int2 = "";
int3 = "";
lr = "";
unitconversion = "";
sumsheet = ss.getSheetByName("COUNTRY_ANALYSIS_NOTE");
|
Generating and displaying data on Country Analysis note
1 2 3 4 5 6 7 8 9 10 11 12 13 14 | filterpage();
/*Loads the JSON data*/
loadDataTemplate();
/*Displays the data for 1.LIVELIHOODS PROGRAMME AND MONITORING SCOPE ; 2. PROFILE OF SAMPLE BENEFICIARIES AT BASELINE; 3. SAMPLE SIZE PER OUTPUT*/
displayDataIndicators123();
/*Displays and generates data for [OUTPUT 1] 4. OUTPUT 1: ACCESS TO AGRICULTURE PRODUCTION ENHANCED; 4.1 AGRICULTURAL EMPLOYMENT; 4.2 AGRICULTURAL PRODUCTIVITY; 4.3 INCOME/SAVING GAINED FROM AGRICULTURE*/
displayDataIndicators4Otput1();
/*Displays and generates data for [OUTPUT 2] 5.1 SELF-EMPLOYMENT; 5.2 INCOME/SAVING GAINED FROM SELF-EMPLOYMENT*/
displayDataIndicator5Output2();
/*Displays and generates data for [OUTPUT 3] 6. OUTPUT 3: ACCESS TO WAGE-EMPLOYMENT*/
displayDataIndicator6Output3();
y2++;
formatText(y2, 2, "For questions regarding the revised monitoring system, data and analysis, please contact: LIVELIHOODS@UNHCR.ORG", "Arimo", 9, "white", "#1c4587", 10, "#1c4587", "right", "0");
y2++;
|
Function IndicatorYN
Warning
it’s recommended that the function be renamed
-
IndicatorYN(header)¶ The function returns the list of headers (specified in template)
- Arguments
header (Object) – list of headers
1 2 3 4 5 6 7 8 9 10 11 12 13 14 15 16 17 | function IndicatorYN(header) {
var result = 0;
for (i = 0; i < jsonData.length; i++) {
if (filterMain(i, jsonData, Country, Partner, Camp, Status, Year, Gender, Age, "ALL", '0', '0') != 9) {
continue;
}
if (jsonData[i][header] == "0") {
continue;
}
if (jsonData[i][header].indexOf(jsonData[i]['PARTNER_INFO/Partner']) > -1 || jsonData[i][header].indexOf(jsonData[i]['PARTNER_INFO/Partner1']) > -1) {
result = 1;
break;
}
}
return result;
}
|
Function generateLabelUnderTable
-
generateLabelUnderTable(x, y)¶ The function generates the label under the table
- Arguments
x (string) – column
y (string) – row
1 2 3 4 5 6 7 8 9 10 | function generateLabelUnderTable(y, x) {
/*idx {string } - year*/
var idx = key["idx"]
var sst = SpreadsheetApp.openById(idx);
var sheet = sst.getSheetByName("Report");
sheet.getRange(y, x + 6).setValue("(Multiple response per beneficiary)");
sheet.getRange(y, x + 6).setFontSize(9);
sheet.getRange(y, x + 6).setFontColor("grey");
sheet.getRange(y, x + 6).setHorizontalAlignment("right");
}
|
Function displayDataIndicators123
-
displayDataIndicators123()¶ The function displays an information/indicators on Country Analysis Note (1.LIVELIHOODS PROGRAMME AND MONITORING SCOPE ; 2. PROFILE OF SAMPLE BENEFICIARIES AT BASELINE; 3. SAMPLE SIZE PER OUTPUT)
1 2 3 4 5 6 7 8 | function displayDataIndicators123() {
/*idx {string } - year*/
var idx = key["idx"];
var sst = SpreadsheetApp.openById(idx);
/*filters {type} - the sheet with the given name [Context]*/
var problem = sst.getSheetByName("Context");
/*sheetbg{type} - the sheet with the given name [BG]*/
var sheetbg = sst.getSheetByName("BG");
|
Context sheet [Beneficiary survey]
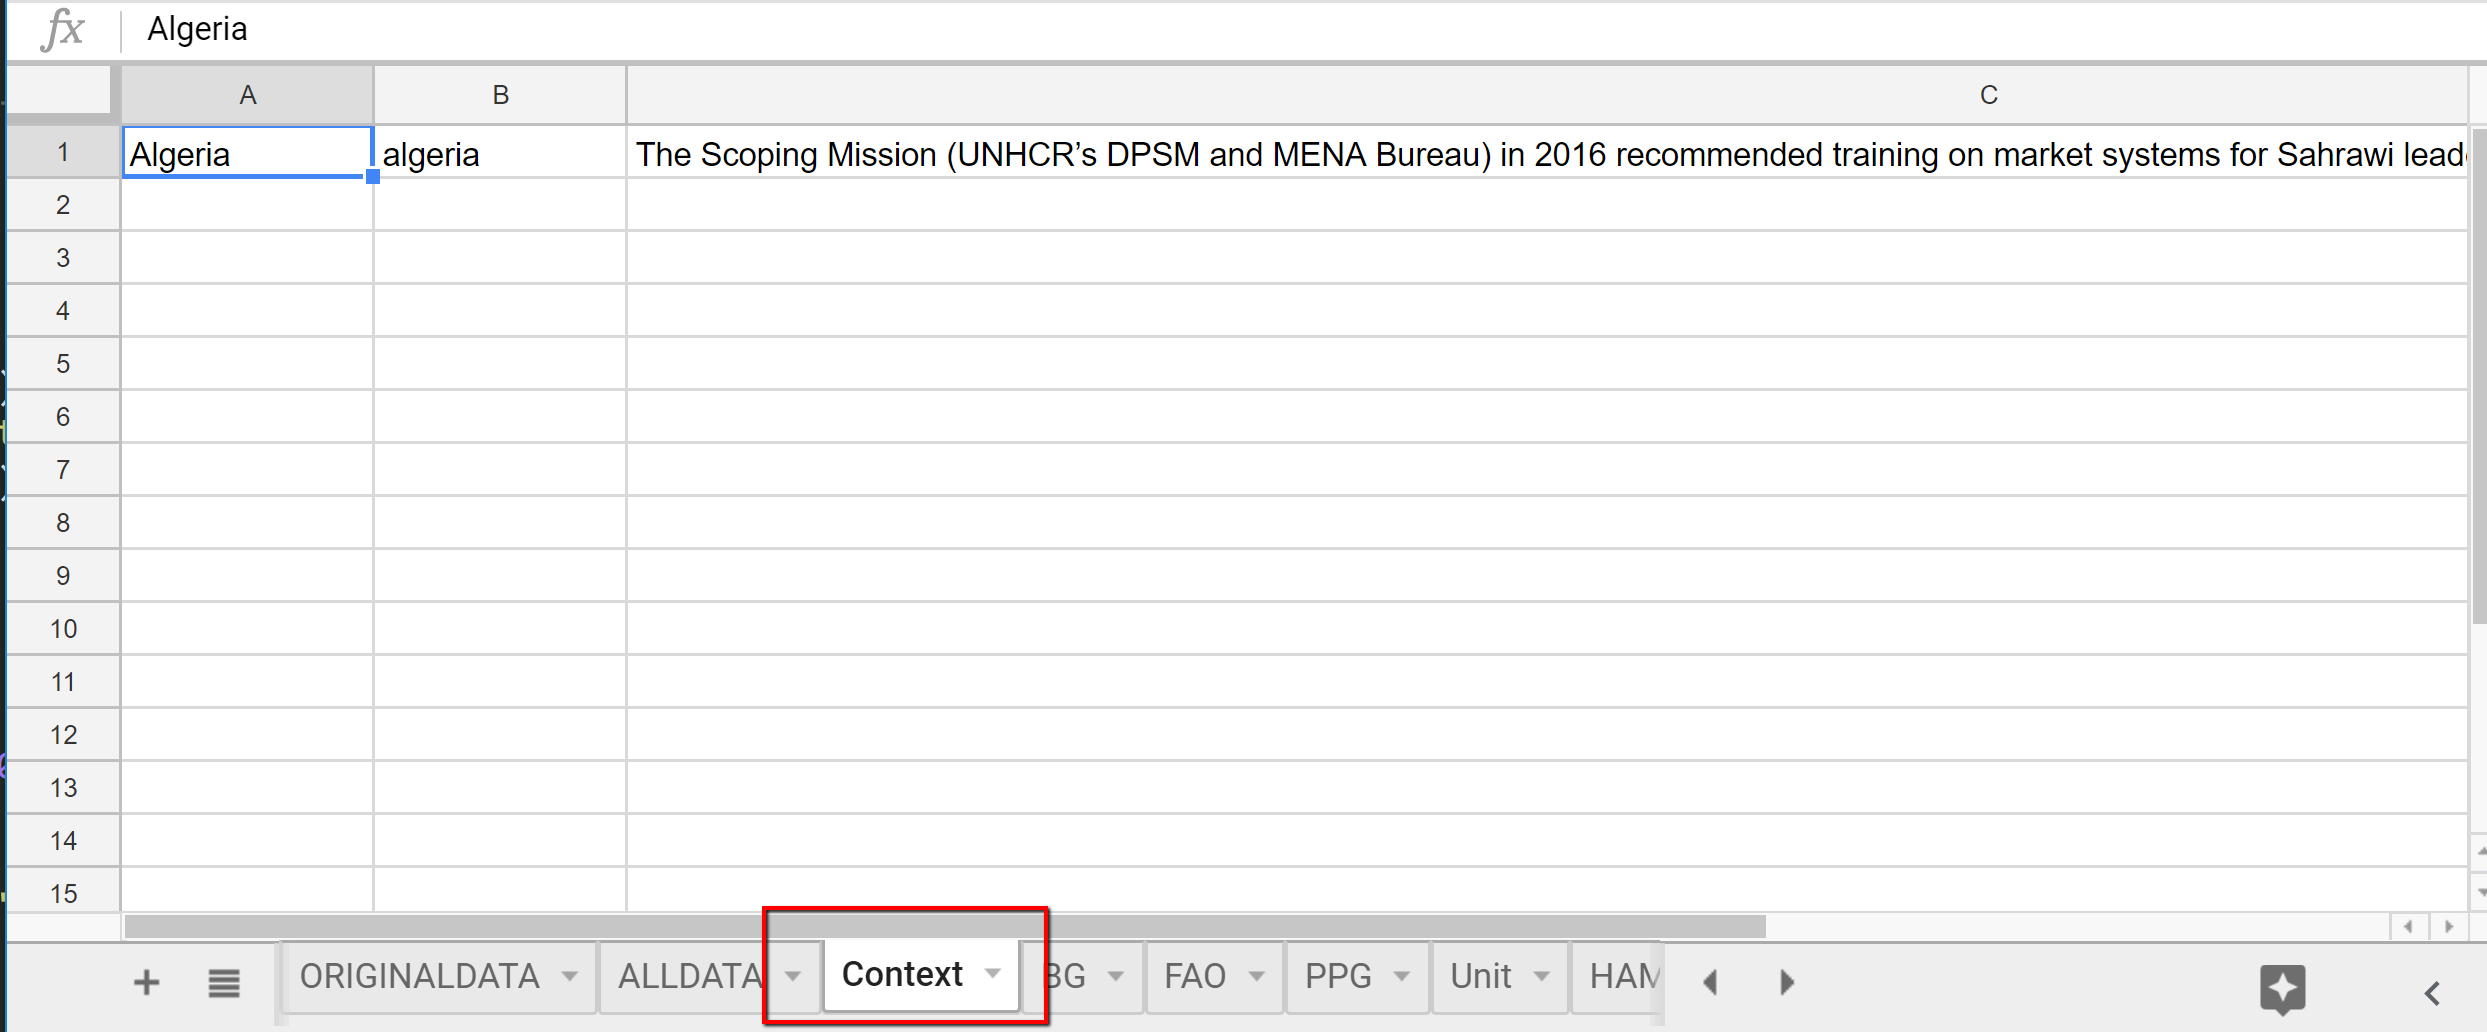
Screenshot of Context sheet
1 | y2++;
|
BG sheet [Beneficiary survey]
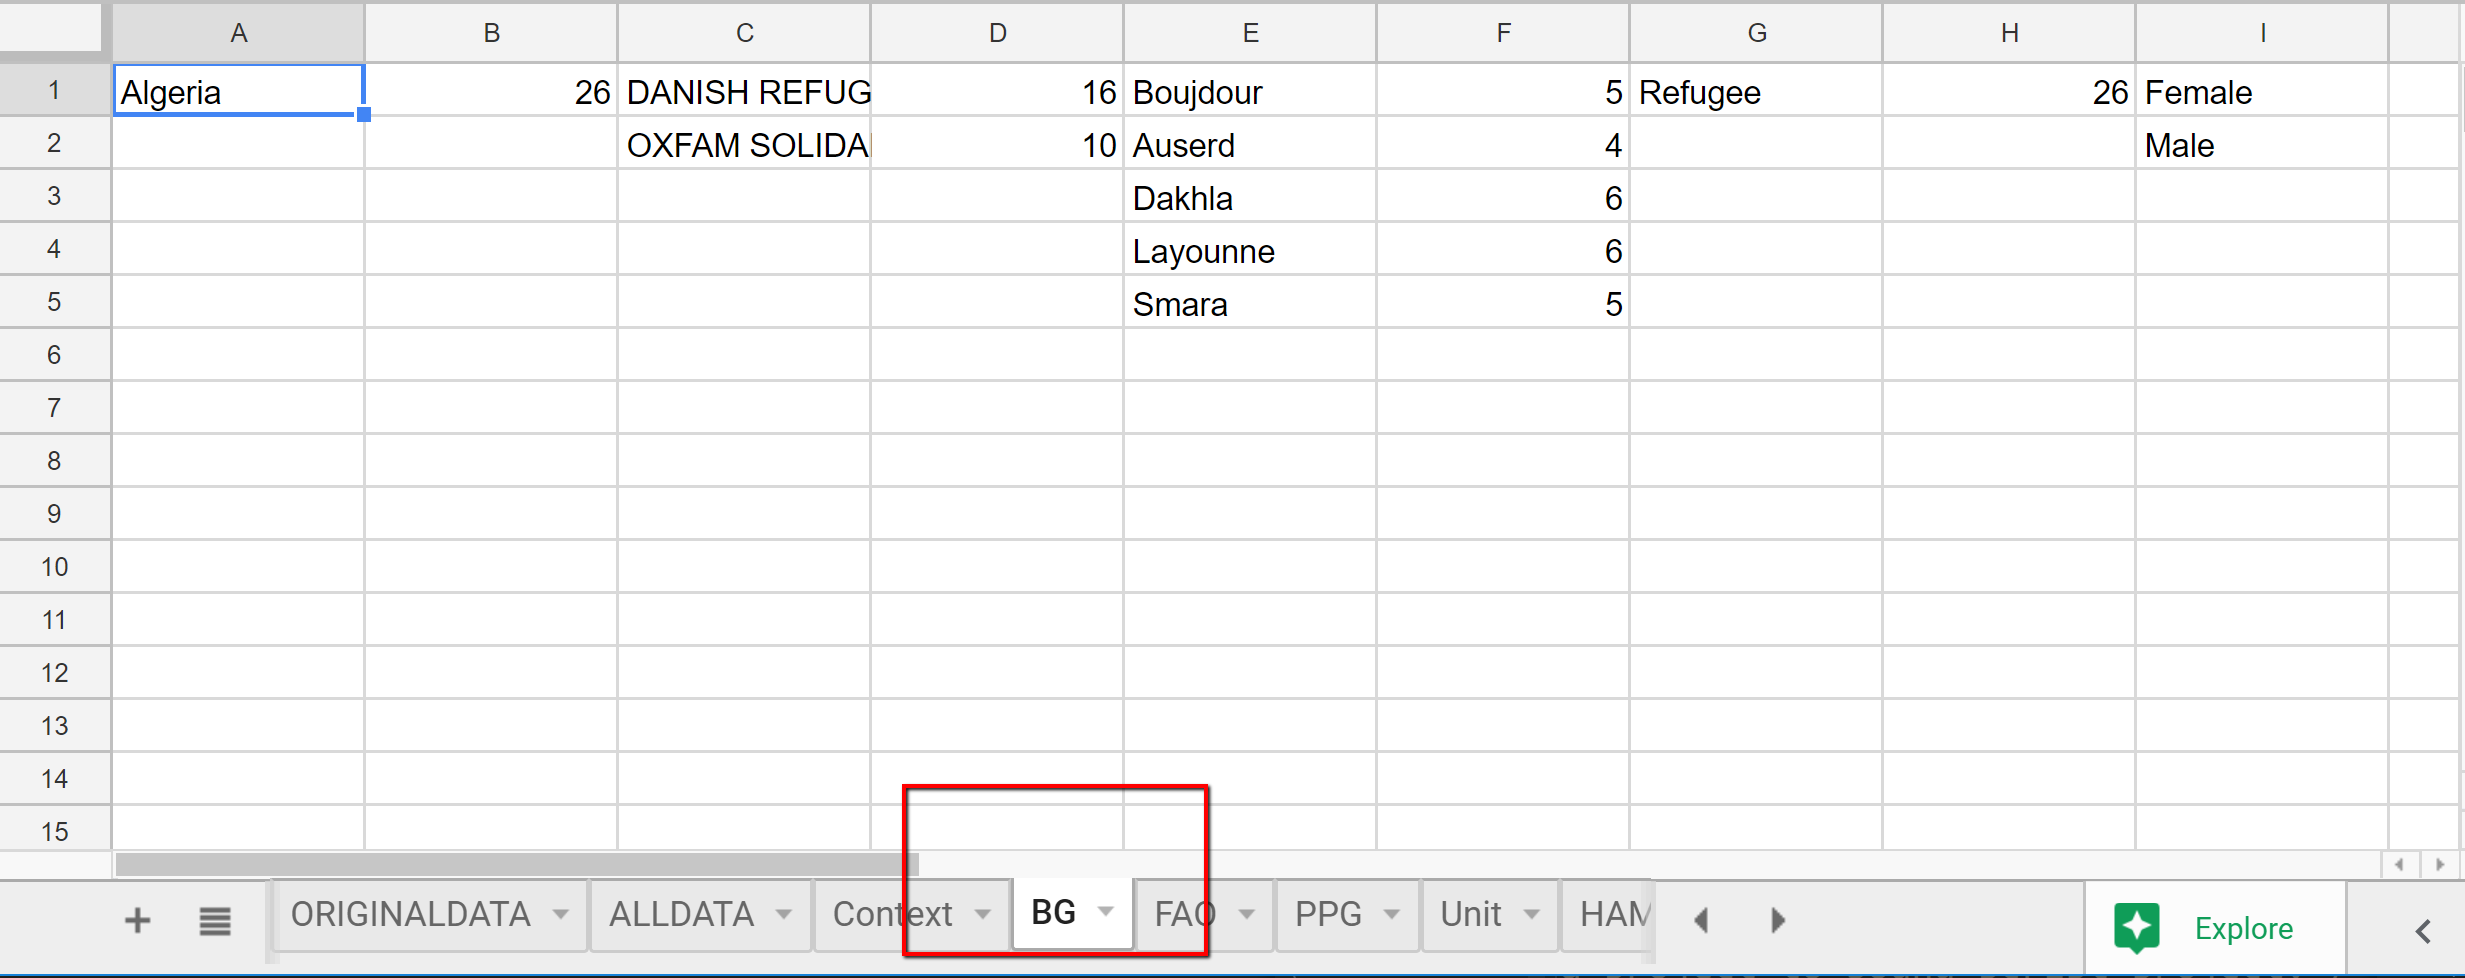
Screenshot of BG sheet
1 2 3 4 5 6 7 8 9 10 11 12 13 14 15 16 17 18 19 20 21 22 23 24 25 26 27 28 29 30 31 | sumsheet.clear()
titlecolor = "#1c4587";
graphcolor = "#cfe2f3";
var range = sumsheet.getRange(1, 1, 300, 50);
for (i = 2; i < 16; i++) {
sumsheet.getRange(1, i).setValue("");
sumsheet.setColumnWidth(i, 100);
}
sumsheet.setColumnWidth(1, 25);
sumsheet.setColumnWidth(2, 25);
sumsheet.setColumnWidth(8, 25);
sumsheet.setColumnWidth(2, 150);
for (i = 1; i < 500; i++) {
sumsheet.setRowHeight(i, 25);
}
sumsheet.getRange(2, 11, 3, 1).merge();
sumsheet.getRange(2, 11).setFormula('=image("https://docs.google.com/uc?export=download&id=1pxnBZ2WdUFrSpqDoeL3v7yJVrFZFHgSg",4,110,100)');
range.setVerticalAlignment("middle");
range.setFontFamily("Arimo");
range.setFontSize(12);
range.setDataValidation(null);
range.setNumberFormat('0');
var d = new Date();
y2 = 2
|
Title of Country Analysis Note
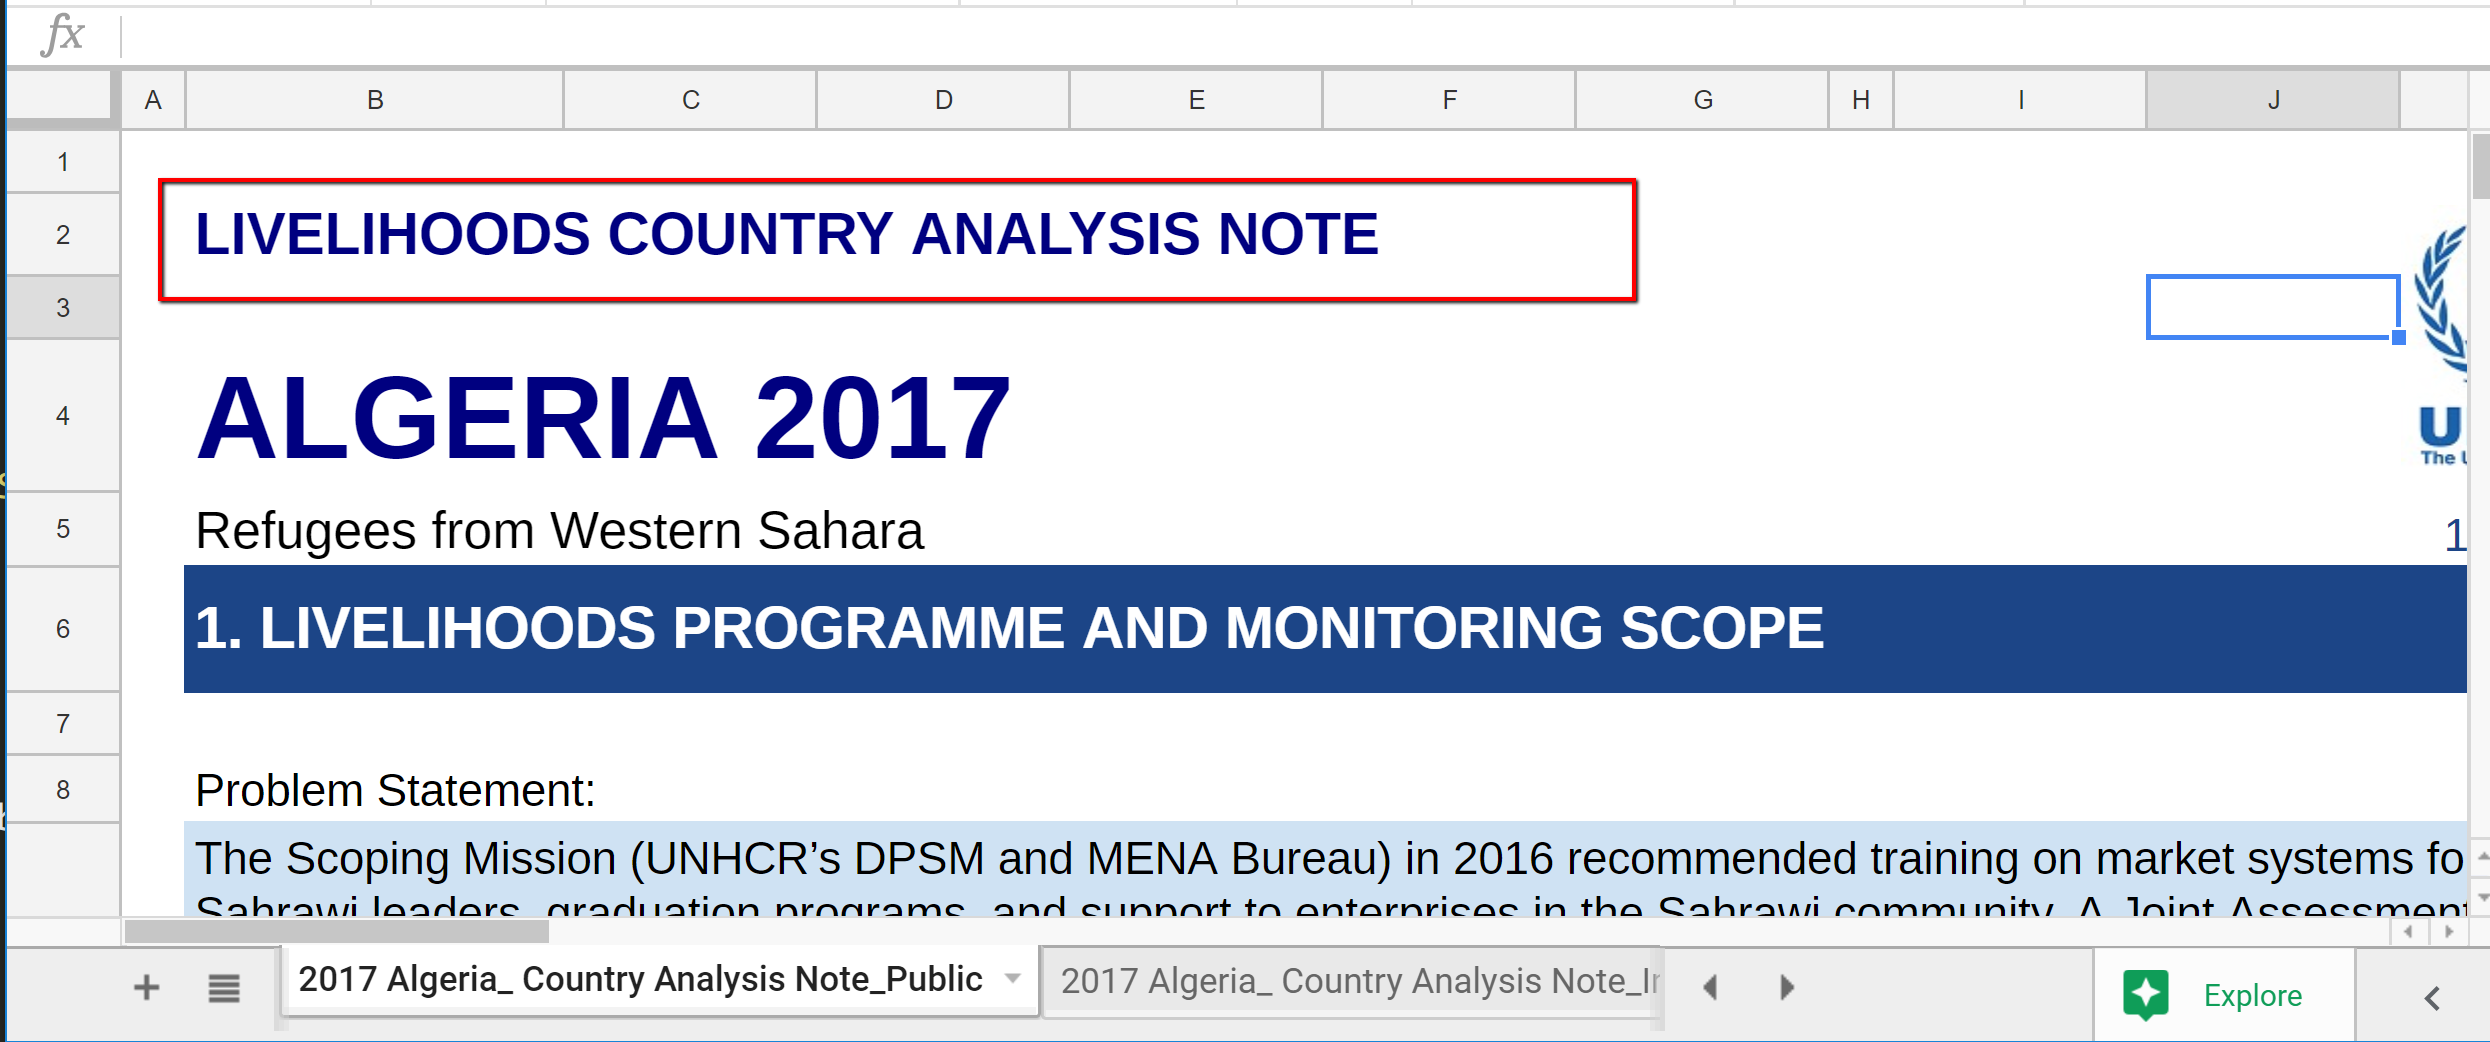
Screenshot of Country Analysis Note
1 2 3 4 5 6 7 8 9 10 11 12 13 14 15 16 17 18 19 20 21 22 23 24 25 26 27 28 29 30 31 32 33 34 35 36 37 38 39 40 41 42 43 44 45 46 47 48 49 50 51 52 53 54 55 56 57 58 59 60 61 62 63 64 65 66 67 68 69 70 71 72 73 74 75 76 77 78 79 80 81 82 83 84 85 86 87 88 89 90 | formatText(y2, 2, "LIVELIHOODS COUNTRY ANALYSIS NOTE", "Arimo", 18, "Navy", "white", 6, "white", "left", "bold");
y2++;
y2++;
/*Benefciciary calculation from BG sheet [Beneficiary data]*/
bgdata = sheetbg.getRange(1, 1, sheetbg.getLastRow(), sheetbg.getLastColumn()).getValues();
/*budget1 = 0;
budget2 = 0;
budget3 = 0;*/
hbene = 0;
pocbene = 0;
pbudget = 0;
camps = 0;
for (id = 0; id < sheetbg.getLastRow(); id++) {
if (bgdata[id][0] == "") {
continue;
}
/*taking data for specific country [Data Analyis]*/
generateTemplateDataSpCountry("ALL", bgdata[id][0]);
}
Country2 = Country;
/*replace header*/
var pppg = formatHeader(['PROGRAMME_SYNOPSIS/PROGRAMME_INFORMATION/PPG'], "Multi").replace(/_/g, " ");
var pppg2;
/*filters {type} -the sheet with the given name [FILTER sheet on Baeneficary data]*/
var filters = sst.getSheetByName("Filter");
/*ppgsheet {type} -the sheet with the given name [PPG sheet]*/
var ppgsheet = sst.getSheetByName("PPG");
var PPGss = ppgsheet.getRange(1, 1, ppgsheet.getLastRow(), ppgsheet.getLastColumn()).getValues();
var cy;
var location_add = "";
for (l = 0; l < PPGss.length; l++) {
if (PPGss[l][0] == "add_location") { location_add = " " + PPGss[l][1]; }
}
if (Country != "ALL") {
cy = Country.toUpperCase() + " " + Year;
for (p = 0; p < PPGss.length; p++) {
if (PPGss[p][0] == Country) {
cy = PPGss[p][1].toUpperCase() + " " + Year;
}
if (Dstation != "" && PPGss[p][0] == Dstation) {
cy = PPGss[p][1].toUpperCase() + " " + Year;
Country = PPGss[p][1];
}
}
} else {
cy = "Global " + Year;
}
formatText(y2, 2, pppg+" "+location_add, "Arimo", 16, "black", "white", 9, "white", "left");
sumsheet.getRange(y2, 2).setWrap(true);
y2++;
cy = "";
try { PROBLEMSTATEMENT = problem.getRange(1, 1, problem.getLastRow(), problem.getLastColumn()).getValues(); } catch (e) { PROBLEMSTATEMENT = ""; }
if (Country != "ALL") {
var usn = filters.getRange(5, 6).getValue();
if (usn == "") { pppg2 = Country.toLowerCase(); } else { pppg2 = usn; }
for (p = 0; p < PPGss.length; p++) {
if (PPGss[p][0] == pppg2) {
pppg = PPGss[p][1].replace(/_/g, " ");
break;
}
}
formatText(y2, 2, pppg, "Arimo", 16, "black", "white", 9, "white", "left");
sumsheet.getRange(y2, 2).setWrap(true);
} else {
for (i = 0; i < sheetbg.getLastRow(); i++) {
if (bgdata[i][0] == "") {
continue;
}
cy = cy + bgdata[i][0];
if (bgdata[i + 1][0] != "") {
cy = cy + ", ";
}
}
formatText(y2, 2, cy, "Arimo", 16, "black", "white", 9, "white", "left");
sumsheet.getRange(y2, 2).setWrap(true);
}
formatText(y2, 11, d, "Arimo", 14, "#1c4587", "white", 1, "white", "right");
sumsheet.getRange(y2, 11, 1, 1).setVerticalAlignment("bottom");
y2++;
/*1. LIVELIHOODS PROGRAMME AND MONITORING SCOPE on country abalysis note*/
|
LIVELIHOODS PROGRAMME AND MONITORING SCOPE on country abalysis note and Problem statemenet
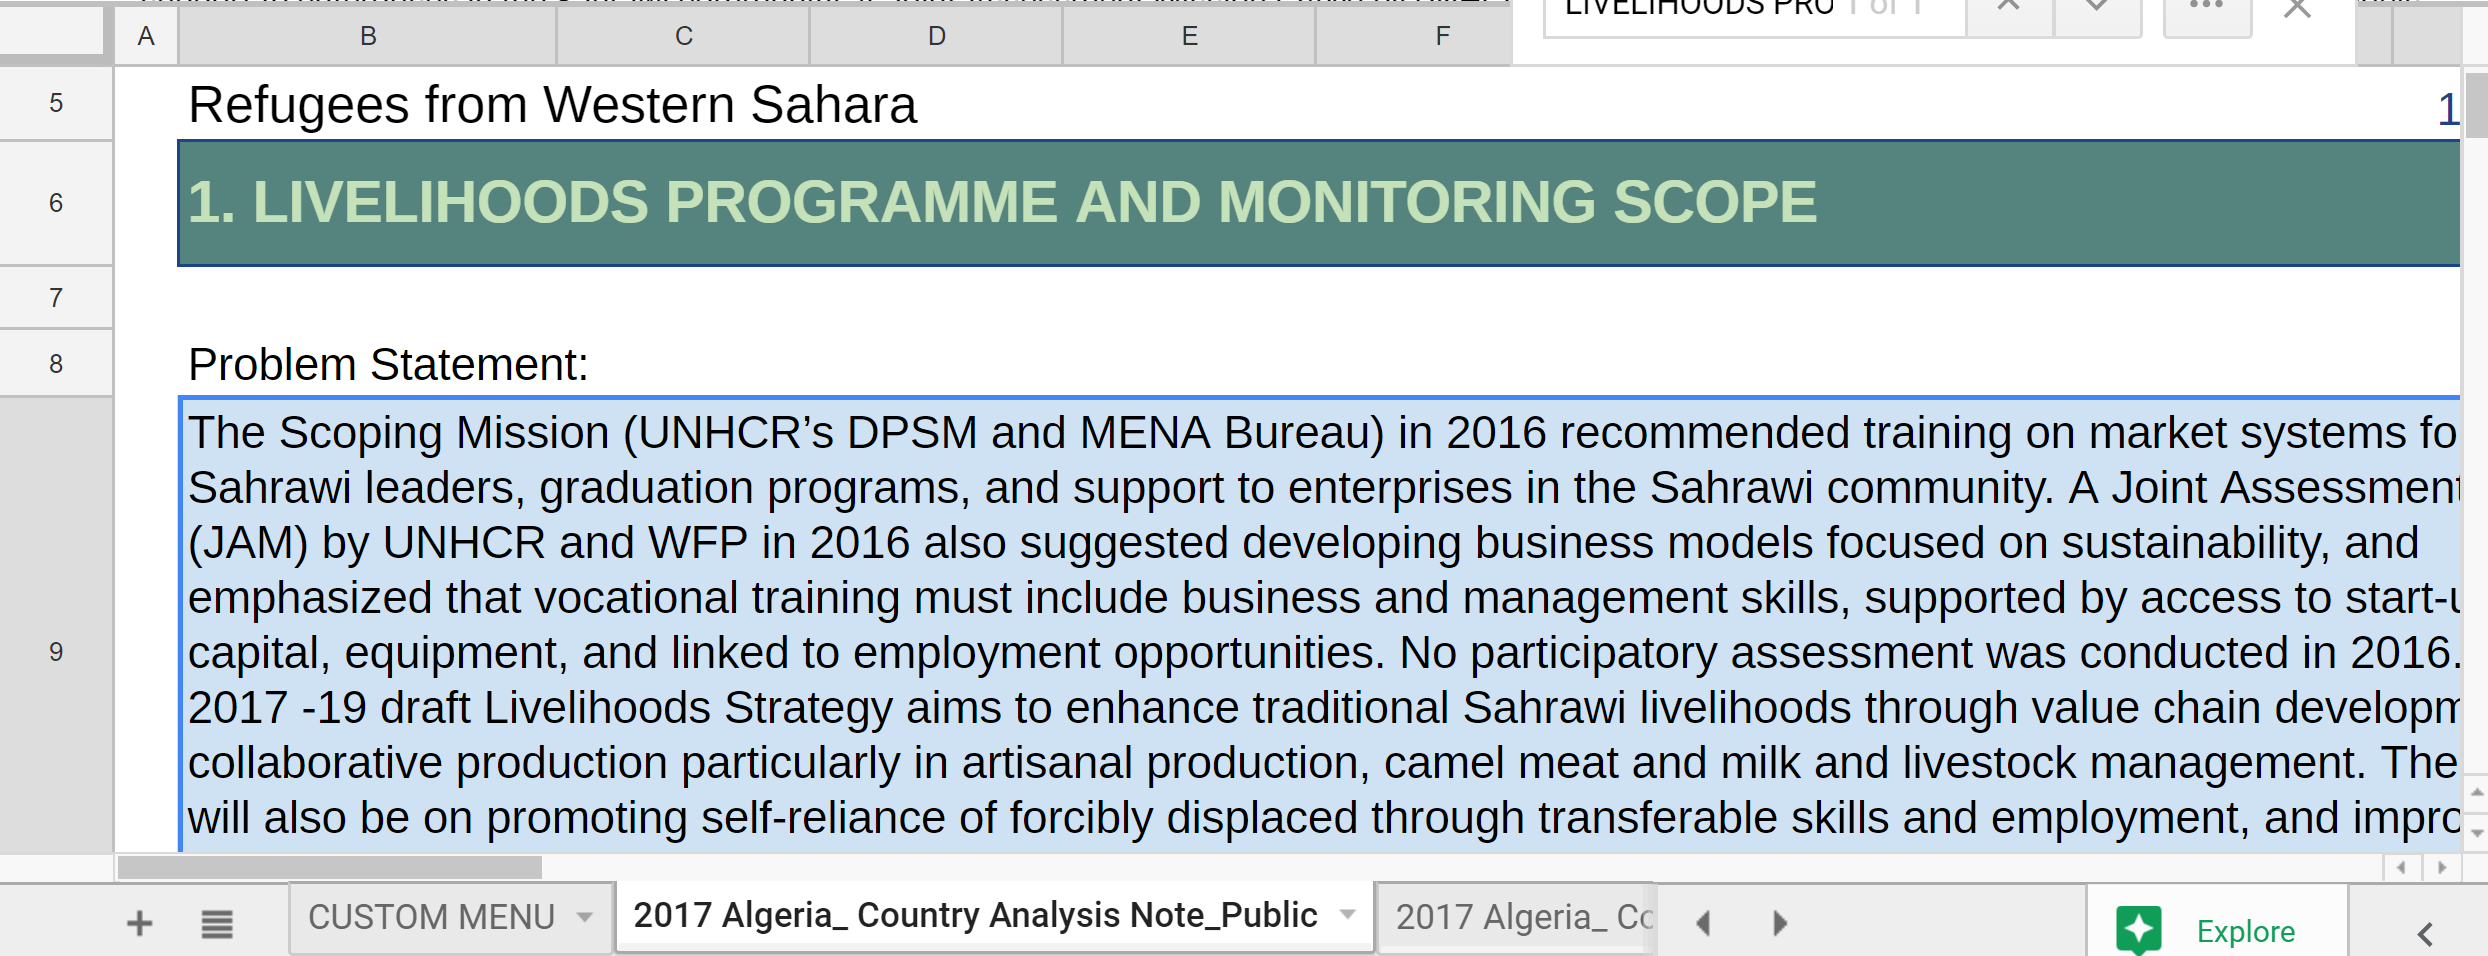
Screenshot of header
1 2 3 4 5 6 7 8 9 10 11 12 13 14 15 16 17 18 19 20 21 22 23 24 25 26 27 28 29 30 31 32 33 34 35 | sumsheet.setRowHeight(y2, 50);
y2 = y2 + 2;
/*2. Problem stateement: */
formatText(y2, 2, "Problem Statement:", "Arimo", 14, "black", "white", 3, "white", "left", "0");
y2++;
/*Displaying problem statement*/
{
var textp = "";
var cccc = 0;
for (pp = 0; pp < PROBLEMSTATEMENT.length; pp++) {
if (PROBLEMSTATEMENT[pp][0] == Country2) {
if (User != "" && PROBLEMSTATEMENT[pp][1] != User) {
continue;
}
if (cccc == 0) {
textp = textp + PROBLEMSTATEMENT[pp][2];
cccc++;
} else {
textp = textp + String.fromCharCode(10) + String.fromCharCode(10) + PROBLEMSTATEMENT[pp][2];
}
} else {
continue;
}
formatText(y2, 2, textp, "Arimo", 14, "black", "#cfe2f3", 10, "#cfe2f3", "left", "Normal");
}
y2++;
y2++;
}
yy = y2;
/*Context */
formatText(y2, 2, "Context:", "Arimo", 14, "black", "white", 3, "white", "left", "0");
|
Context
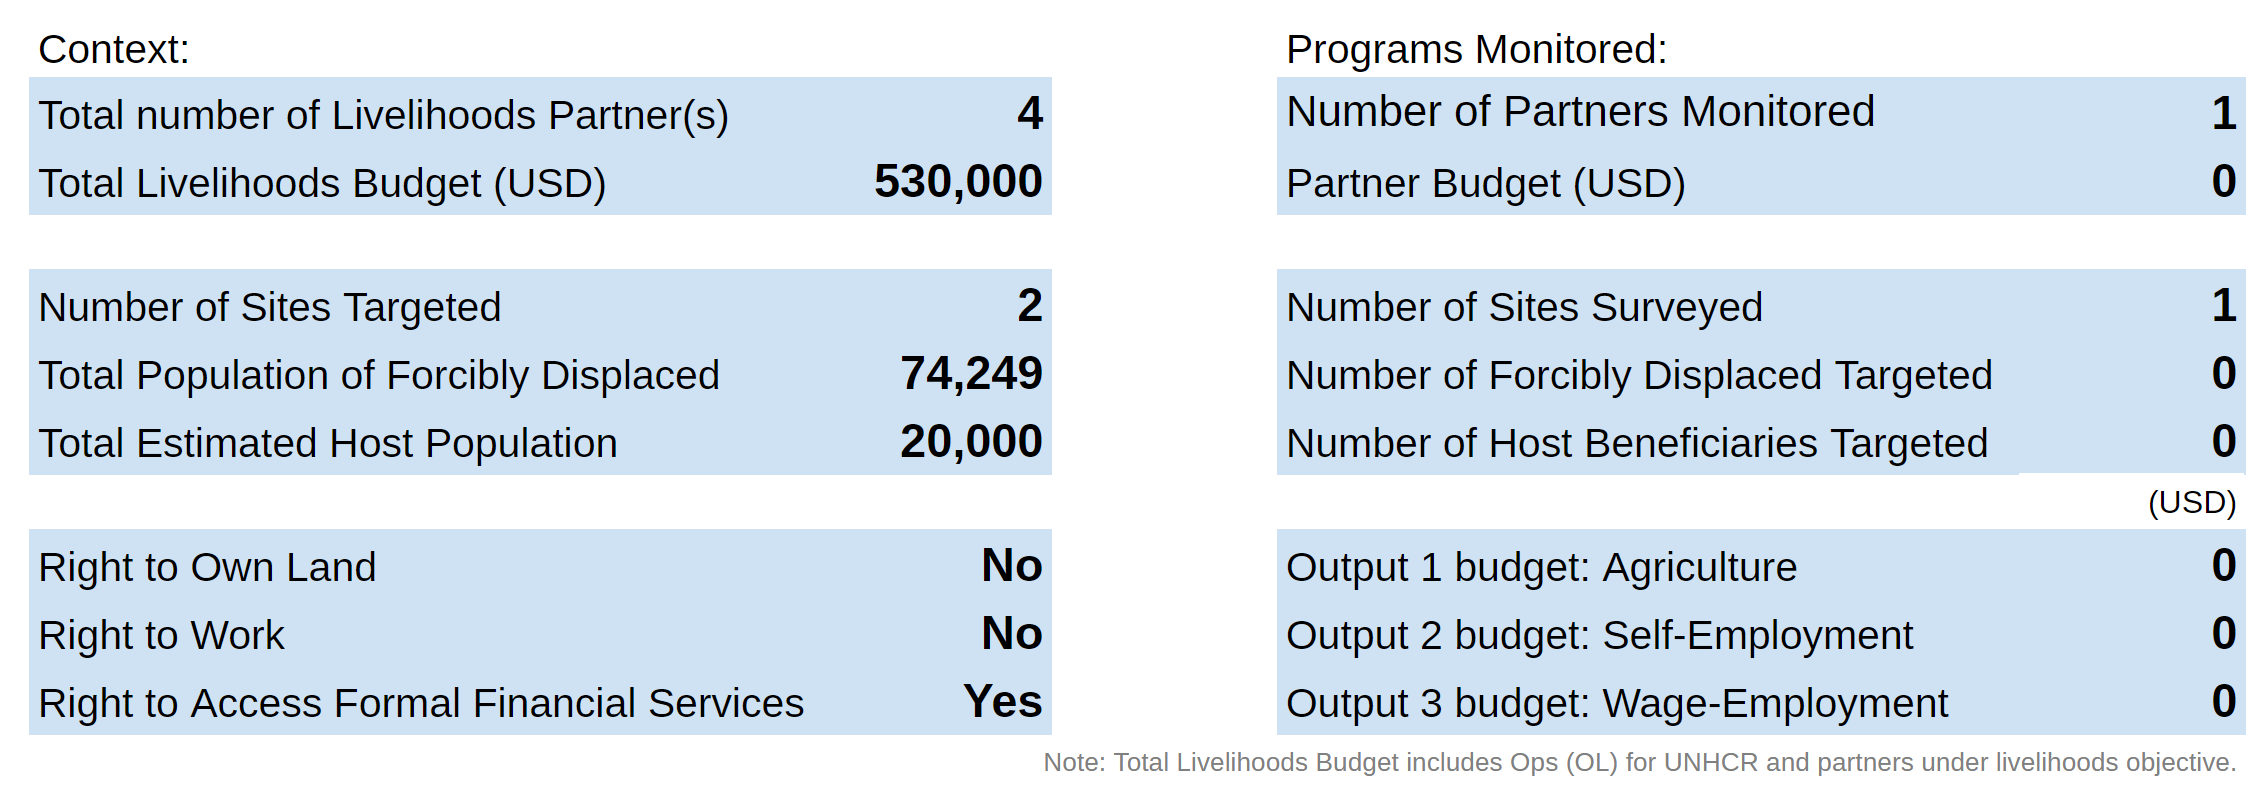
Screenshot of header
1 2 3 4 5 6 7 8 9 10 11 12 13 14 15 16 17 18 19 20 21 22 23 24 25 26 27 28 29 30 31 32 33 34 35 36 37 38 39 40 41 42 43 44 45 46 47 48 49 50 51 52 53 54 55 56 57 58 59 60 61 62 63 64 65 66 67 68 69 70 71 72 73 74 75 76 77 78 79 80 81 82 83 84 85 86 87 88 89 90 91 92 93 94 95 96 97 98 99 100 101 102 103 104 105 106 107 108 109 110 111 112 113 114 115 116 117 118 119 120 121 122 123 124 125 126 127 128 129 130 131 132 133 134 135 136 137 138 139 140 141 142 143 144 145 146 147 148 149 150 151 152 153 154 155 156 157 158 159 160 161 162 163 164 165 166 167 168 169 170 171 172 173 174 175 176 177 178 179 180 181 182 183 184 185 186 187 188 189 190 191 192 193 194 195 | y2++;
/*formatText(y2, 2, "Total number of Livelihoods Partner(s)", "Arimo", 14, "black", "#cfe2f3", 3, "#cfe2f3", "left", "0");
formatText(y2, 5, npartner, "Arimo", 16.5, "black", "#cfe2f3", 1, "#cfe2f3", "right", "bold");
sumsheet.getRange(y2, 5).setNumberFormat('#,##0;[Red](#,##0)');
y2++;*/
//GETTING FOCUS BUDGET
var total_budget;
var total_partner_budget;
var total_partner_number;
for (p = 0; p < PPGss.length; p++) {
if (PPGss[p][0] == pppg2+"_total_budget") {
total_budget = PPGss[p][1];
}
if (PPGss[p][0] == pppg2+"_total_partner_budget") {
total_partner_budget = PPGss[p][1];
}
if (PPGss[p][0] == pppg2 + "_total_partner_number") {
total_partner_number = PPGss[p][1];
}
}
formatText(y2, 2, "Total number of Livelihoods Partner(s)", "Arimo", 14, "black", "#cfe2f3", 3, "#cfe2f3", "left", "0");
formatText(y2, 5, npartner, "Arimo", 16.5, "black", "#cfe2f3", 1, "#cfe2f3", "right", "bold");
if (total_partner_number != "" && total_partner_number != null) { formatText(y2, 5, total_partner_number, "Arimo", 16.5, "black", "#cfe2f3", 1, "#cfe2f3", "right", "bold"); }
sumsheet.getRange(y2, 5).setNumberFormat('#,##0;[Red](#,##0)');
y2++;
formatText(y2, 2, "Total Livelihoods Programme (USD)", "Arimo", 14, "black", "#cfe2f3", 3, "#cfe2f3", "left", "0");
formatText(y2, 5, totalbudget, "Arimo", 16.5, "grey", "#cfe2f3", 1, "#cfe2f3", "right", "bold");
if (total_budget != "" && total_budget != null) {formatText(y2, 5, total_budget, "Arimo", 16.5, "black", "#cfe2f3", 1, "#cfe2f3", "right", "bold");}
sumsheet.getRange(y2, 5).setNumberFormat('#,##0;[Red](#,##0)');
y2++;
y2++;
if (camps < takeUniqueDataBGsheet(5, "0")) { camps = takeUniqueDataBGsheet(5, "0"); }
formatText(y2, 2, "Number of Sites Targeted", "Arimo", 14, "black", "#cfe2f3", 3, "#cfe2f3", "left", "0");
formatText(y2, 5, camps, "Arimo", 16.5, "black", "#cfe2f3", 1, "#cfe2f3", "right", "bold");
sumsheet.getRange(y2, 5).setNumberFormat('#,##0;[Red](#,##0)');
y2++;
/*Survey Partner calculation*/
budget1 = 0;
budget2 = 0;
budget3 = 0;
hbene = 0;
pocbene = 0;
pbudget = 0;
camps = 0;
int1 = "";
int2 = "";
int3 = "";
/*Loop through BG data sheet*/
for (cx = 0; cx < sheetbg.getLastRow(); cx++) {
if (bgdata[cx][0] == "") {
continue;
}
for (itd = 0; itd < sheetbg.getLastRow(); itd++) {
if (bgdata[itd][2] == "") {
continue;
}
/*takes data (partner, country)*/
generateTemplateDataSpCountry(bgdata[itd][2], bgdata[cx][0]);
/*Total number of forcibly displaced targeted [Output1]*/
tpocbene1 = tpocbene1 + pocbene1;
pocbene1 = 0;
/*Total number of forcibly displaced targeted [Intervention]*/
tpocbene2 = tpocbene2 + pocbene2;
pocbene2 = 0;
/* Total number of forcibly displaced targeted [Title]*/
tpocbene3 = tpocbene3 + pocbene3;
pocbene3 = 0;
/*Total number of host beneficiaries targeted [Output]*/
thbene1 = thbene1 + hbene1;
hbene1 = 0;
/*Total number of host beneficiaries targeted [Intervention]*/
thbene2 = thbene2 + hbene2;
hbene2 = 0;
/*Total number of host beneficiaries targeted [Title]*/
thbene3 = thbene3 + hbene3;
hbene3 = 0;
}
}
/*Total Population of Forcibly Displaced*/
var fsize = 16.5;
if (totalpoc > 9999999 || totalhost > 9999999) { fsize = 14; }
if (totalpoc < tpocbene1 + tpocbene2 + tpocbene3) { totalpoc = tpocbene1 + tpocbene2 + tpocbene3; }
formatText(y2, 2, "Total Population of Forcibly Displaced", "Arimo", 14, "black", "#cfe2f3", 3, "#cfe2f3", "left", "0");
formatText(y2, 5, totalpoc, "Arimo", fsize, "black", "#cfe2f3", 1, "#cfe2f3", "right", "bold");
sumsheet.getRange(y2, 5).setNumberFormat('#,##0;[Red](#,##0)');
y2++;
/* Total Estimated Host Population*/
if (totalhost < thbene1 + thbene2 + thbene3) { totalhost = thbene1 + thbene2 + thbene3; }
formatText(y2, 2, "Total Estimated Host Population", "Arimo", 14, "black", "#cfe2f3", 3, "#cfe2f3", "left", "0");
formatText(y2, 5, totalhost, "Arimo", fsize, "black", "#cfe2f3", 1, "#cfe2f3", "right", "bold");
sumsheet.getRange(y2, 5).setNumberFormat('#,##0;[Red](#,##0)');
y2++;
y2++;
/*Right to Own Land */
formatText(y2, 2, "Right to Own Land", "Arimo", 14, "black", "#cfe2f3", 3, "#cfe2f3", "left", "0");
var landownership,
employment,
financial;
if (Country == "ALL") {
landownership = "NA";
employment = "NA";
financial = "NA";
} else {
landownership = formatHeader(['PROBLEM_STATEMENT/LEGAL_ACCESS/L_Assessment_Land']);
// if (landownership == "Yes") { landownership = "Yes, without any significant restrictions";}
//if (landownership == "Some") { landownership = "Yes, with restrictions";}
employment = formatHeader(['PROBLEM_STATEMENT/LEGAL_ACCESS/L_Assessment_Employment']); employment = formatHeader(['PROBLEM_STATEMENT/LEGAL_ACCESS/L_Assessment_Employment']);
//if (employment == "Yes") { employment = "Yes, without any significant restrictions";}
//if (employment == "Some") { employment = "Yes, with restrictions";}
financial = formatHeader(['PROBLEM_STATEMENT/LEGAL_ACCESS/L_Assessment_Finance']); financial = formatHeader(['PROBLEM_STATEMENT/LEGAL_ACCESS/L_Assessment_Finance']);
//if (financial == "Yes") { financial= "Yes, without any significant restrictions";}
//if (financial == "Some") {financial = "Yes, with restrictions";}
}
formatText(y2, 5, landownership, "Arimo", 16.5, "black", "#cfe2f3", 1, "#cfe2f3", "right", "bold");
y2++;
/*Right to Work*/
formatText(y2, 2, "Right to Work", "Arimo", 14, "black", "#cfe2f3", 3, "#cfe2f3", "left", "0");
formatText(y2, 5, employment, "Arimo", 16.5, "black", "#cfe2f3", 1, "#cfe2f3", "right", "bold");
y2++;
/*Right to Access Formal Financial Services */
formatText(y2, 2, "Right to Access Formal Financial Services", "Arimo", 14, "black", "#cfe2f3", 3, "#cfe2f3", "left", "0");
formatText(y2, 5, financial, "Arimo", 16.5, "black", "#cfe2f3", 1, "#cfe2f3", "right", "bold");
y2++;
y2 = y2 - 10;
formatText(y2 - 1, 7, "Programs Monitored:", "Arimo", 14, "black", "white", 3, "white", "left", "0");
formatText(y2, 7, "Number of Partners Monitored", "Arimo", 14, "black", "#cfe2f3", 4, "#cfe2f3", "left", "0");
formatText(y2, 11, takeUniqueDataBGsheet(3, "0"), "Arimo", 16.5, "black", "#cfe2f3", 1, "#cfe2f3", "right", "bold");
y2++;
formatText(y2, 7, "Partner Project (USD)", "Arimo", 14, "black", "#cfe2f3", 4, "#cfe2f3", "left", "0");
if(total_partner_budget!=""){formatText(y2, 11, total_partner_budget, "Arimo", 16.5, "black", "#cfe2f3", 1, "#cfe2f3", "right", "bold");}
sumsheet.getRange(y2, 11).setNumberFormat('#,##0;[Red](#,##0)');
y2++;
y2++;
formatText(y2, 7, "Number of Sites Surveyed", "Arimo", 14, "black", "#cfe2f3", 4, "#cfe2f3", "left", "0");
formatText(y2, 11, takeUniqueDataBGsheet(5, "0"), "Arimo", 16.5, "black", "#cfe2f3", 1, "#cfe2f3", "right", "bold");
y2++;
formatText(y2, 7, "Number of Forcibly Displaced Targeted", "Arimo", 14, "black", "#cfe2f3", 4, "#cfe2f3", "left", "0");
formatText(y2, 11, tpocbene1 + tpocbene2 + tpocbene3, "Arimo", 16.5, "black", "#cfe2f3", 1, "#cfe2f3", "right", "bold");
sumsheet.getRange(y2, 11).setNumberFormat('#,##0;[Red](#,##0)');
y2++;
formatText(y2, 7, "Number of Host Beneficiaries Targeted", "Arimo", 14, "black", "#cfe2f3", 4, "#cfe2f3", "left", "0");
formatText(y2, 11, thbene1 + thbene2 + thbene3, "Arimo", 16.5, "black", "#cfe2f3", 1, "#cfe2f3", "right", "bold");
sumsheet.getRange(y2, 11).setNumberFormat('#,##0;[Red](#,##0)');
y2++;
formatText(y2, 10, "(Resource allocation)", "Arimo", 11, "black", "white", 2, "white", "right", "0")
y2++;
var budget1percent=Math.round(budget1/(budget1+budget2+budget3)*100)/100;
formatText(y2, 7, "Output 1 : Agriculture", "Arimo", 14, "black", "#cfe2f3", 4, "#cfe2f3", "left", "0");
formatText(y2, 11, budget1percent, "Arimo", 16.5, "black", "#cfe2f3", 1, "#cfe2f3", "right", "bold");
sumsheet.getRange(y2, 11).setNumberFormat('#,##0;[Red](#,##0)'); sumsheet.getRange(y2, 11, 3, 1).setNumberFormat('0%;[Red](0%)');
//sumsheet.getRange(y2, 11).setNumberFormat('#,##0;[Red](#,##0)');
sumsheet.getRange(y2, 11).setNumberFormat('#,##0;[Red](#,##0)');
y2++;
var budget2percent=Math.round(budget2/(budget1+budget2+budget3)*100)/100;
formatText(y2, 7, "Output 2: Self-Employment", "Arimo", 14, "black", "#cfe2f3", 4, "#cfe2f3", "left", "0");
formatText(y2, 11, budget2percent, "Arimo", 16.5, "black", "#cfe2f3", 1, "#cfe2f3", "right", "bold");
//sumsheet.getRange(y2, 11).setNumberFormat('#,##0;[Red](#,##0)');
y2++;
var budget3percent=1-budget1percent-budget2percent;
formatText(y2, 7, "Output 3: Wage-Employment", "Arimo", 14, "black", "#cfe2f3", 4, "#cfe2f3", "left", "0");
formatText(y2, 11, budget3percent, "Arimo", 16.5, "black", "#cfe2f3", 1, "#cfe2f3", "right", "bold");
//sumsheet.getRange(y2, 11).setNumberFormat('#,##0;[Red](#,##0)');
y2++;
formatNote(y2, 11, "Note: Total Livelihoods Programme includes UNHCR and partners' project expenditures under livelihoods objective.")
y2++;
formatNote(y2, 11, "Note: Access to landownership, work and financial services, 'Yes' indicates 'Yes, without any significant restrictions', while 'Some' indicates 'Yes, with restrictions'.")
//sumsheet.getRange(y2, 11, 1, 1).setWrap(true);
|
PROFILE OF SAMPLE BENEFICIARIES AT BASELINE/ENDLINE

Screenshot of header
1 2 3 4 5 6 7 8 9 10 11 12 13 14 15 16 17 18 19 20 21 22 23 24 25 26 27 28 29 30 31 32 33 34 35 36 37 38 39 40 41 42 43 44 45 46 47 48 49 50 51 52 53 54 55 56 57 58 59 60 61 62 63 64 65 66 67 68 69 70 71 72 73 74 75 76 77 78 79 80 81 82 83 84 85 86 87 88 89 90 91 92 93 94 95 96 97 98 99 100 101 102 103 104 105 | y2++;
/*2. Profile Beneficiaries at baseline*/
formatText(y2, 9, "Sample Size:", "Arimo", 11, "black", "white", 1, "white", "right", "0");
formatText(y2, 10, "Baseline", "Arimo", 11, "black", "white", 1, "white", "right", "0");
formatText(y2, 11, "Endline", "Arimo", 11, "black", "white", 1, "white", "right", "0")
/*SetWrap is false*/
sumsheet.getRange(y2, 9, 1, 3).setWrap(false);
/*et the vertical alignment of table cells.*/
sumsheet.getRange(y2, 9, 1, 3).setVerticalAlignment("bottom");
y2++;
var baseline = countTotalNumCategoryIndicator2Agr(jsonData, "Country", ["Total"], "Baseline", "1");
endline = countTotalNumCategoryIndicator2Agr(jsonData, "Country", ["Total"], "Endline", "1")
/*Baseline*/
if (baseline != 0) {
formatText(y2, 2, "2. PROFILE OF SAMPLE BENEFICIARIES AT BASELINE", "Arimo", 18, "white", "#1c4587", 7, "#1c4587", "left", "bold");
sumsheet.setRowHeight(y2, 50);
formatText(y2, 9, "", "Arimo", 24, "white", "#1c4587", 1, "#1c4587", "right", "bold");
formatText(y2, 10, baseline, "Arimo", 24, "white", "#1c4587", 1, "#1c4587", "right", "bold");
formatText(y2, 11, endline, "Arimo", 24, "white", "#1c4587", 1, "#1c4587", "right", "bold");
y2++;
y2++;
formatText(y2, 2, "% of Refugees/Asylum Seekers", "Arimo", 15, "black", "#cfe2f3", 3, "#cfe2f3", "left", "0");
formatText(y2, 5, countTotalNumCategoryIndicator2Agr(jsonData, "BENEFICIARY_INFO/Status", ["Refugee", "Asylum_Seeker", "Stateless"], "Baseline", "0") / baseline, "Arimo", 18, "black", "#cfe2f3", 1, "#cfe2f3", "right", "bold");
y2++;
formatText(y2, 2, "% of Former Refugees", "Arimo", 15, "black", "#cfe2f3", 3, "#cfe2f3", "left", "0");
formatText(y2, 5, countTotalNumCategoryIndicator2Agr(jsonData, "BENEFICIARY_INFO/Status", ["Resident_Status", "Naturalised", "Returnee"], "Baseline", "0") / baseline, "Arimo", 18, "black", "#cfe2f3", 1, "#cfe2f3", "right", "bold");
y2++;
formatText(y2, 2, "% of IDPs", "Arimo", 15, "black", "#cfe2f3", 3, "#cfe2f3", "left", "0");
formatText(y2, 5, countTotalNumCategoryIndicator2Agr(jsonData, "BENEFICIARY_INFO/Status", ["IDP"], "Baseline", "0") / baseline, "Arimo", 18, "black", "#cfe2f3", 1, "#cfe2f3", "right", "bold");
y2++;
formatText(y2, 2, "% of Host Communities", "Arimo", 15, "black", "#cfe2f3", 3, "#cfe2f3", "left", "0");
formatText(y2, 5, countTotalNumCategoryIndicator2Agr(jsonData, "BENEFICIARY_INFO/Status", ["Host_Community"], "Baseline", "0") / baseline, "Arimo", 18, "black", "#cfe2f3", 1, "#cfe2f3", "right", "bold");
y2 = y2 - 3;
formatText(y2, 7, "% of Female Beneficiaries", "Arimo", 15, "black", "#cfe2f3", 4, "#cfe2f3", "left", "0");
formatText(y2, 11, countTotalNumCategoryIndicator2Agr(jsonData, "BENEFICIARY_INFO/Gender", ["Female"], "Baseline", "0") / baseline, "Arimo", 18, "black", "#cfe2f3", 1, "#cfe2f3", "right", "bold");
sumsheet.getRange(y2, 5, 4, 1).setNumberFormat('0%;[Red](0%)');
sumsheet.getRange(y2, 11, 4, 1).setNumberFormat('0%;[Red](0%)');
y2++;
formatText(y2, 7, "% of Elderly (>=65) Beneficiaries", "Arimo", 15, "black", "#cfe2f3", 4, "#cfe2f3", "left", "0");
formatText(y2, 11, countTotalNumAgeGroup(jsonData, "BENEFICIARY_INFO/Age", 65, 0, "Baseline", "0") / baseline, "Arimo", 18, "black", "#cfe2f3", 1, "#cfe2f3", "right", "bold");
y2++;
formatText(y2, 7, "% of Youth (<18) Beneficiaries", "Arimo", 15, "black", "#cfe2f3", 4, "#cfe2f3", "left", "0");
formatText(y2, 11, countTotalNumAgeGroup(jsonData, "BENEFICIARY_INFO/Age", 1000, 17, "Baseline", "0") / baseline, "Arimo", 18, "black", "#cfe2f3", 1, "#cfe2f3", "right", "bold");
y2++;
formatText(y2, 7, "% with Dependency Ratio >2.0", "Arimo", 15, "black", "#cfe2f3", 4, "#cfe2f3", "left", "0");
formatText(y2, 11, countTotalNumIndicator2Dependency(jsonData, "DEPENDENCY", "Baseline", 2, 100), "Arimo", 18, "black", "#cfe2f3", 1, "#cfe2f3", "right", "bold");
y2++;
formatNote(y2, 11, "Note: FORMER REFUGEES includes returnees, naturalised refugees, or refugees with resident status.")
}
/*Endline*/
else if (endline > 0) {
formatText(y2, 2, "2. PROFILE OF SAMPLE BENEFICIARIES AT ENDLINE", "Arimo", 18, "white", "#1c4587", 7, "#1c4587", "left", "bold");
sumsheet.setRowHeight(y2, 50);
formatText(y2, 9, "", "Arimo", 24, "white", "#1c4587", 1, "#1c4587", "right", "bold");
formatText(y2, 10, baseline, "Arimo", 24, "white", "#1c4587", 1, "#1c4587", "right", "bold");
formatText(y2, 11, endline, "Arimo", 24, "white", "#1c4587", 1, "#1c4587", "right", "bold");
y2++;
y2++;
formatText(y2, 2, "% of Refugees/Asylum Seekers", "Arimo", 15, "black", "#cfe2f3", 3, "#cfe2f3", "left", "0");
formatText(y2, 5, countTotalNumCategoryIndicator2Agr(jsonData, "BENEFICIARY_INFO/Status", ["Refugee", "Asylum_Seeker", "Stateless"], "Endline", "0") / endline, "Arimo", 18, "black", "#cfe2f3", 1, "#cfe2f3", "right", "bold");
y2++;
formatText(y2, 2, "% of Former Refugees", "Arimo", 15, "black", "#cfe2f3", 3, "#cfe2f3", "left", "0");
formatText(y2, 5, countTotalNumCategoryIndicator2Agr(jsonData, "BENEFICIARY_INFO/Status", ["Resident_Status", "Naturalised", "Returnee"], "Endline", "0") / endline, "Arimo", 18, "black", "#cfe2f3", 1, "#cfe2f3", "right", "bold");
y2++;
formatText(y2, 2, "% of IDPs", "Arimo", 15, "black", "#cfe2f3", 3, "#cfe2f3", "left", "0");
formatText(y2, 5, countTotalNumCategoryIndicator2Agr(jsonData, "BENEFICIARY_INFO/Status", ["IDP"], "Endline", "0") / endline, "Arimo", 18, "black", "#cfe2f3", 1, "#cfe2f3", "right", "bold");
y2++;
formatText(y2, 2, "% of Host Communities", "Arimo", 15, "black", "#cfe2f3", 3, "#cfe2f3", "left", "0");
formatText(y2, 5, countTotalNumCategoryIndicator2Agr(jsonData, "BENEFICIARY_INFO/Status", ["Host_Community"], "Endline", "0") / endline, "Arimo", 18, "black", "#cfe2f3", 1, "#cfe2f3", "right", "bold");
y2 = y2 - 3;
formatText(y2, 7, "% of Female Beneficiaries", "Arimo", 15, "black", "#cfe2f3", 4, "#cfe2f3", "left", "0");
formatText(y2, 11, countTotalNumCategoryIndicator2Agr(jsonData, "BENEFICIARY_INFO/Gender", ["Female"], "Endline", "0") / endline, "Arimo", 18, "black", "#cfe2f3", 1, "#cfe2f3", "right", "bold");
sumsheet.getRange(y2, 5, 4, 1).setNumberFormat('0%;[Red](0%)');
sumsheet.getRange(y2, 11, 4, 1).setNumberFormat('0%;[Red](0%)');
y2++;
formatText(y2, 7, "% of Elderly (>=65) Beneficiaries", "Arimo", 15, "black", "#cfe2f3", 4, "#cfe2f3", "left", "0");
formatText(y2, 11, countTotalNumAgeGroup(jsonData, "BENEFICIARY_INFO/Age", 65, 0, "Endline", "0") / endline, "Arimo", 18, "black", "#cfe2f3", 1, "#cfe2f3", "right", "bold");
y2++;
|
SAMPLE SIZE PER OUTPUT
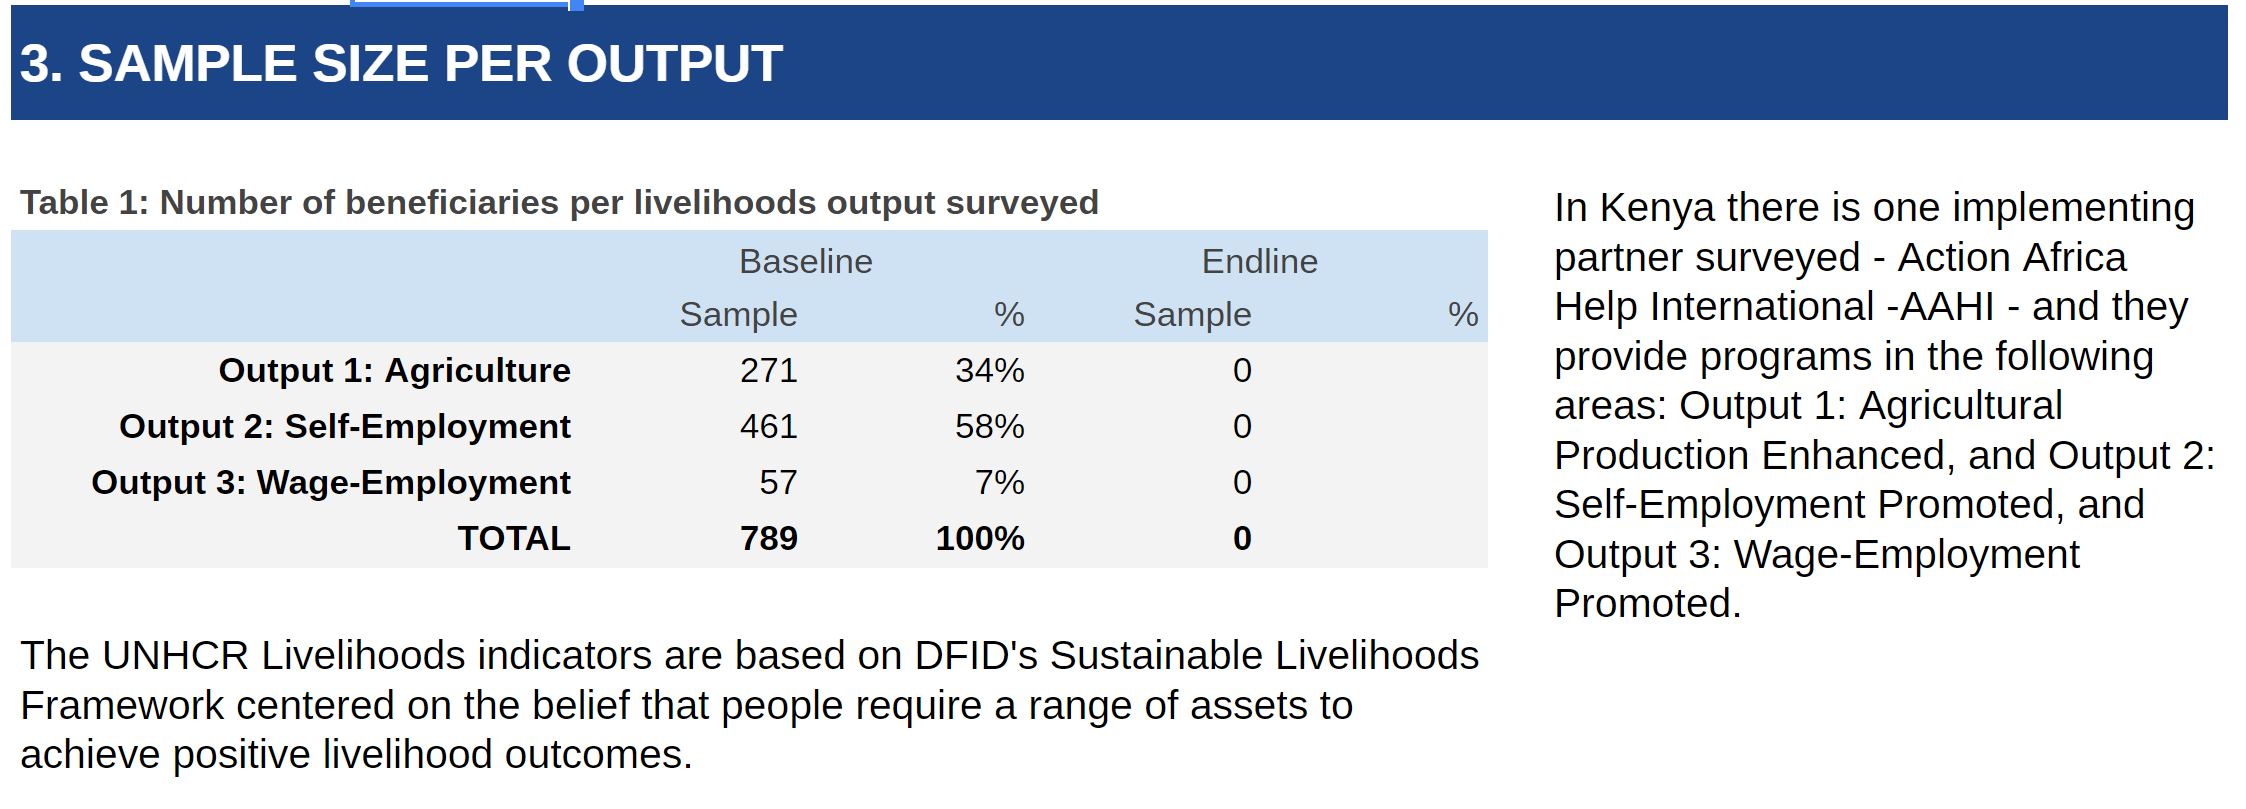
Screenshot of header
1 2 3 4 5 6 7 8 9 10 11 12 13 14 | y2++;
formatText(y2, 7, "% with Dependency Ratio >2.0", "Arimo", 15, "black", "#cfe2f3", 4, "#cfe2f3", "left", "0");
formatText(y2, 11, countTotalNumIndicator2Dependency(jsonData, "DEPENDENCY", "Endline", 2, 100), "Arimo", 18, "black", "#cfe2f3", 1, "#cfe2f3", "right", "bold");
y2++;
formatText(y2, 2, "Note: 1) FORMER REFUGEES includes returnees, naturalised refugees, or refugees with resident status, 2) Due to timing of roll-out of revised monitoring tools and program implementation, only an Endline survey was completed as the beneficiaries had already begun participation in the program.", "Arimo", 10, "grey", "white", 10, "white", "left", "0");
y2++;
}
y2++;
y2++;
/*SAMPLE SIZE PER OUTPUT*/
|
*OUTPUT1
1 2 3 4 5 6 7 | /*presents the table*/
formatTables(y2, 3, ttb, 'Table ' + tn + ': Number of beneficiaries per livelihoods output surveyed',1);
/*generates the narrative part*/
displayNarrative3SampleSize(y2 - ttb.length - 2, 9, ttb.length + 1);
sumsheet.getRange(y2 - ttb.length - 2, 9).setWrap(true);
/*generates the narrative 2nd part*/
displayNarrativeIndicator3(y2, 2, 1);
|
Function displayDataIndicators4Otput1
-
displayDataIndicators4Otput1()¶ The functions generates and displays data for 4. OUTPUT 1: ACCESS TO AGRICULTURE PRODUCTION ENHANCED
4. OUTPUT 1: ACCESS TO AGRICULTURE PRODUCTION ENHANCED
1 2 3 4 5 6 7 8 9 10 11 12 13 14 15 16 17 18 19 20 21 22 23 24 25 26 27 28 29 30 31 32 33 34 35 36 37 38 39 40 41 42 43 44 45 46 47 48 49 | function displayDataIndicators4Otput1() {
/*Count baseline for Output */
totaloutputbl = countTotalNumCategoryIndicator2Agr(jsonData, "PARTNER_INFO/Output", ["O1"], "Baseline", "1");
/*Count endline for Output2 */
totaloutputel = countTotalNumCategoryIndicator2Agr(jsonData, "PARTNER_INFO/Output2", ["O1"], "Endline", "1");
totaloutput = totaloutputbl + totaloutputel;
if (IndicatorYN('O1') == 1 && totaloutput > 0) {
x2 = 6;
titlecolor = "#134f5c";
graphcolor = "#d9ead3";
/*4.1 AGRICULTURAL EMPLOYMENT*/
{
/*Table 2: Sample beneficiaries per agricultural sub-sectors */
var table301 = generateTablePercentIndicatorImpact([['Farming'], ['Livestock'], ['Fishery']], ['Crop production', 'Livestock', 'Fishery'], jsonData, ["G_OUTPUT1/O1_SubSector"]);
/*Table 3: Interventions provided to sample beneficiaries by type*/
var table302 = generateTablePercentIndicatorImpact([['O1_HA'], ['O1_SA'], ['O1_FPA_ASSETS', 'O1_FPA_CASH'], ['O1_MPPA'], ['O1_FA'], ['O1_MAPD'], ['O1_EMP']], ['Human Assets', 'Social Assets', 'Productive Assets', 'Protecting Productive Assets', 'Financial Access', 'Market Access', 'Employment Support'], jsonData, ["G_OUTPUT1/O1_Intervention"]);
/*Table 4: % of forcibly displaced targeted who are wage/self employed in the agricultural sector */
var table3101 = generateTablePercentIndicatorImpactChange([['Self_Permanent', 'Self_Monthly', 'Self_Daily'], ['Wage_Permanent', 'Wage_Monthly', 'Wage_Daily'], ['No']], ['Self-Employment', 'Wage-Employment', 'No Employment'], jsonData, ["G_OUTPUT1/O1_Agricultural_Employment/O1_Employment_Sustainability", "G_OUTPUT1/O1_Agricultural_Employment/O1_Employment"], "No");
/* Table 5: % of forcibly displaced targeted who are wage/self employed on a permanent / monthly / seasonal basis in the agricultural sector */
var table311 = generateTablePercentIndicatorImpactChange([['Self_Permanent'], ['Self_Monthly'], ['Self_Daily'], ['Wage_Permanent'], ['Wage_Monthly'], ['Wage_Daily']], ['Self Permanent', 'Self Monthly', 'Self Daily', 'Wage Permanent', 'Wage Monthly', 'Wage Daily'], jsonData, ["G_OUTPUT1/O1_Agricultural_Employment/O1_Employment_Sustainability"], "No");
/*Table 6: Number of others employed by self-employed beneficiaries */
var tableNumberOtherEmpl = TablecountNumItemsIndicator42Agr(['Family', 'Friends', 'Other refugees', 'Host community'], jsonData, ['G_OUTPUT1/O1_Agricultural_Employment/O1_Employment_Others_No/O1_Employment_Others_No_Family',
'G_OUTPUT1/O1_Agricultural_Employment/O1_Employment_Others_No/O1_Employment_Others_No_Friends',
'G_OUTPUT1/O1_Agricultural_Employment/O1_Employment_Others_No/O1_Employment_Others_No_Refugees',
'G_OUTPUT1/O1_Agricultural_Employment/O1_Employment_Others_No/O1_Employment_Others_No_Host'], "No");
var table313 = generateTablePercentIndicatorImpactChange([['Family', 'Friends', 'Other_Refugees', 'Host_Community'], ['No']], ['Yes', 'No'], jsonData, ["G_OUTPUT1/O1_Agricultural_Employment/O1_Employment_Others"], "No");
}
/*OUTPUT1 TITLE*/
{
formatText(y2, 11, "", "Arimo", 11, "black", "white", 1, "white", "right", "0");
y2++;
formatText(y2, 2, "4. OUTPUT 1: ACCESS TO AGRICULTURE PRODUCTION ENHANCED", "Arimo", 18, "white", titlecolor, 8, titlecolor, "left", "bold");
formatText(y2, 10, "", "Arimo", 24, "white", titlecolor, 2, titlecolor, "right", "bold");
sumsheet.setRowHeight(y2, 50);
y2++;
y2++;
formatText(y2, 2, "Total number of forcibly displaced targeted", "Arimo", 15, "black", graphcolor, 3, graphcolor, "left", "0");
formatText(y2, 5, tpocbene1, "Arimo", 18, "black", graphcolor, 1, graphcolor, "right", "bold");
sumsheet.getRange(y2, 5).setNumberFormat('#,##0;[Red](#,##0)');
formatText(y2, 7, "Total number of host beneficiaries targeted", "Arimo", 15, "black", graphcolor, 4, graphcolor, "left", "0");
formatText(y2, 11, thbene1, "Arimo", 18, "black", graphcolor, 1, graphcolor, "right", "bold");
|
Table: Sample beneficiaries per agricultural sub-sectors and narrative

Screenshot of table
1 2 3 4 5 6 7 8 | if (totaloutputel > 0) { var msgend = " and " + totaloutputel + " at endline" } else { var msgend = ""; }
var msgtemp = "For Output 1: 'Access to Agricultural Production Enhanced', " + String(tpocbene1).replace(/(\d)(?=(\d{3})+(?!\d))/g, '$1,') + " forcibly displaced and " + String(thbene1).replace(/(\d)(?=(\d{3})+(?!\d))/g, '$1,') + " host beneficiaries were targeted for the program, of which " + totaloutputbl + " beneficiaries were surveyed at baseline" + msgend + "."
formatText(y2, 2, msgtemp, "Arimo", 14, "black", "white", 10, "white", "left", "0");
y2++;
y2++;
/*generates the narrative part for 4. OUTPUT 1: ACCESS TO AGRICULTURE PRODUCTION ENHANCED*/
displayNarrativeIndicator4OutputTable1(y2, 2, 1, tn);
y2++;
|
Table: Interventions provided to sample beneficiaries by type
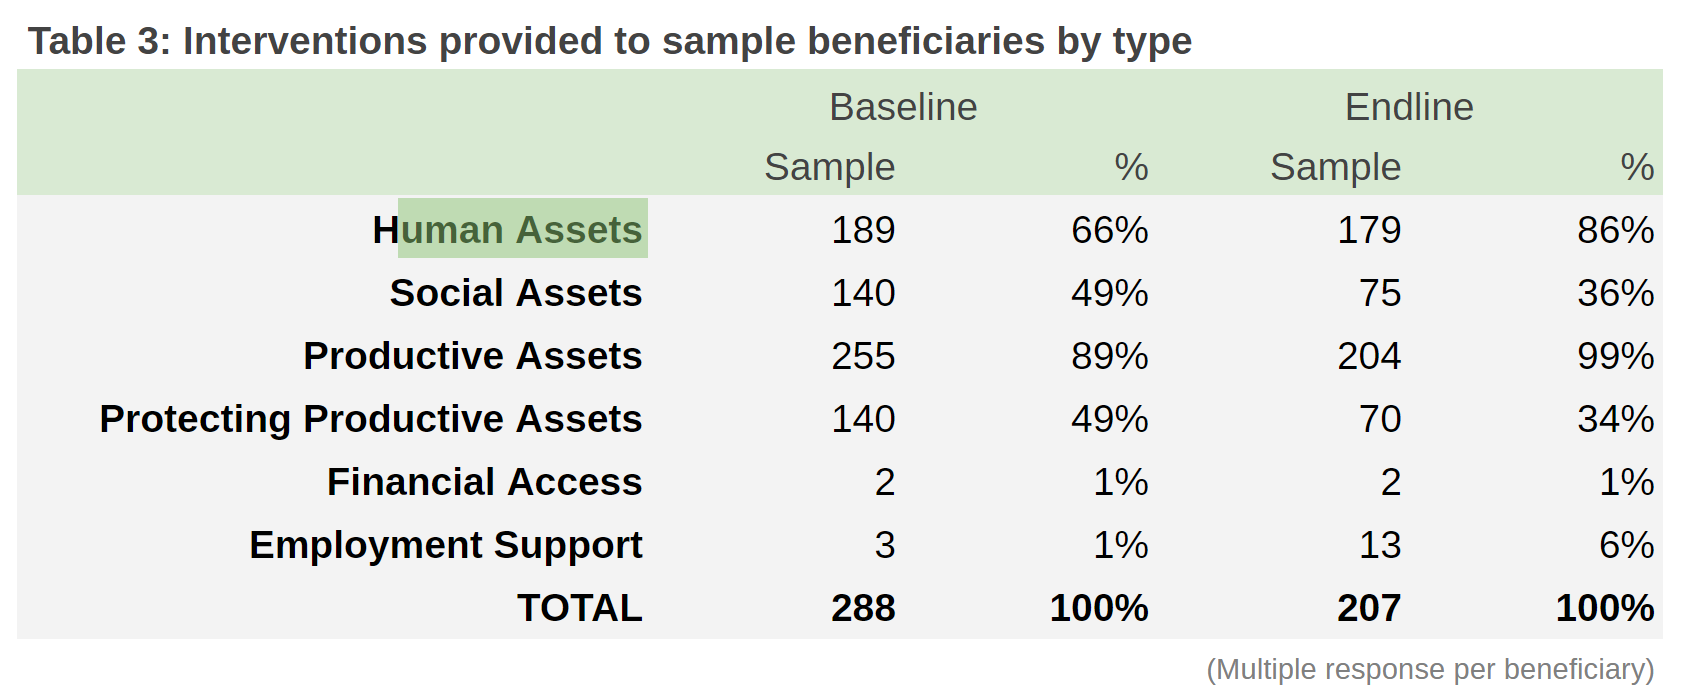
Screenshot of table
1 2 3 4 5 6 7 8 | }
/*Intervention*/
{
/*Table : Sample beneficiaries per agricultural sub-sectors*/
tn++;
formatTables(y2, 3, table301, 'Table ' + tn + ': Sample beneficiaries per agricultural sub-sectors',1);
table = table301.concat();
|
Average cost of productive assets received per beneficiary (Crop production) per year

Screenshot of Average cost of productive assets received per beneficiary
1 2 3 4 5 6 7 8 9 10 11 12 13 14 15 16 17 18 | y2++;
/*Table 3: Interventions provided to sample beneficiaries by type*/
tn++;
formatTables(y2, 3, table302, 'Table ' + tn + ': Interventions provided to sample beneficiaries by type',1);
/*generates label under the table*/
displayLabelIndicator4Ouput1(y2, x2);
y2++;
formatText(y2 - 1, 2, "Note: The types of interventions are based on DFID's Sustainable Livelihoods Framework. Human Assets include all types of training; Social Assets include promotion of groups, associations, cooperatives, etc.; Productive or Financial Assets include provision of land, animals, fishery, poultry, seeds, seedlings, plants, etc.; Protecting Productive Assets include fertilizer, pesticides, vaccinations, extension services, etc.; Market Access includes marketing and transportation support. Product Differentiation includes packaging, labelling, certification, organic farming, etc. and Employment Support includes case management/individual coaching or labor market matching programs.", "Arimo", 10, "grey", "white", 10, "white", "left", "0");
y2++;
}
/*Partner Survey Data*/
{
if (jsonPartner.length > 0) {
var cx = 0;
var cx2 = 0;
|
Average cost of productive assets received per beneficiary (Livestock) per year

Screenshot of indicator
1 2 3 4 5 6 7 8 9 10 11 12 13 14 15 16 17 18 19 20 21 22 23 24 25 26 27 28 | var nominator = 0;
var denominator = 0;
nominator = nominator + countNumItemsPartnerData(jsonPartner, "G_OUTPUT1/O1_FPA_FarmingAssets/O1_FPA_FarmingAssets_Cost");
denominator = denominator + countNumItemsPartnerData(jsonPartner, "G_OUTPUT1/O1_FPA_FarmingAssets/O1_FPA_FarmingAssets_Actual");
denominator = denominator + countNumItemsPartnerData(jsonPartner, "G_OUTPUT1/O1_FPA_FarmingAssets/O1_FPA_FarmingAssets_Actual_Host");
if (denominator > 0) {
formatText(y2, 2, "Average cost of productive assets received per beneficiary (Crop production) per year", "Arimo", 15, "black", graphcolor, 8, graphcolor, "left", "0");
formatText(y2, 10, String(Math.round(((nominator * pexr) / denominator) * 100) / 100).replace(/(\d)(?=(\d{3})+(?!\d))/g, '$1,') + " USD", "Arimo", 18, "black", graphcolor, 2, graphcolor, "right", "bold");
y2++;
y2++;
cx++;
}
/*Average cost of productive assets received per beneficiary (Livestock) per year */
nominator = 0;
denominator = 0;
nominator = nominator + countNumItemsPartnerData(jsonPartner, "G_OUTPUT1/O1_FPA_LivestockAssets/O1_FPA_LivestockAssets_Cost");
denominator = denominator + countNumItemsPartnerData(jsonPartner, "G_OUTPUT1/O1_FPA_LivestockAssets/O1_FPA_LivestockAssets_Actual");
denominator = denominator + countNumItemsPartnerData(jsonPartner, "G_OUTPUT1/O1_FPA_LivestockAssets/O1_FPA_LivestockAssets_Actual_Host");
if (denominator > 0) {
formatText(y2, 2, "Average cost of productive assets received per beneficiary (Livestock) per year", "Arimo", 15, "black", graphcolor, 8, graphcolor, "left", "0");
formatText(y2, 10, String(Math.round(((nominator * pexr) / denominator) * 100) / 100).replace(/(\d)(?=(\d{3})+(?!\d))/g, '$1,') + " USD", "Arimo", 18, "black", graphcolor, 2, graphcolor, "right", "bold");
y2++;
y2++;
cx++;
}
|
Average value of cash grants per beneficiary per year for agricultural production

Screenshot of indicator
1 2 3 4 5 6 7 8 9 10 11 12 13 14 | /*Average value of cash grants per beneficiary per year for agricultural production*/
nominator = 0;
denominator = 0;
nominator = nominator + countNumItemsPartnerData(jsonPartner, "G_OUTPUT1/O1_FPA_FisheryAssets/O1_FPA_FisheryAssets_Cost");
denominator = denominator + countNumItemsPartnerData(jsonPartner, "G_OUTPUT1/O1_FPA_FisheryAssets/O1_FPA_FisheryAssets_Actual");
denominator = denominator + countNumItemsPartnerData(jsonPartner, "G_OUTPUT1/O1_FPA_FisheryAssets/O1_FPA_FisheryAssets_Actual_Host");
if (denominator > 0) {
formatText(y2, 2, "Average cost of productive assets received per beneficiary (Fishery) per year", "Arimo", 15, "black", graphcolor, 8, graphcolor, "left", "0");
formatText(y2, 10, String(Math.round(((nominator * pexr) / denominator) * 100) / 100).replace(/(\d)(?=(\d{3})+(?!\d))/g, '$1,') + " USD", "Arimo", 18, "black", graphcolor, 2, graphcolor, "right", "bold");
y2++;
y2++;
cx++;
}
|
Average value of support to protect agricultural productive assets per beneficiary per year

Screenshot of indicator
1 2 3 4 5 6 7 8 9 10 11 12 13 14 15 16 17 18 19 20 21 22 23 24 25 26 27 | nominator = 0;
denominator = 0;
nominator = nominator + countNumItemsPartnerData(jsonPartner, "G_OUTPUT1/O1_FPA_001/O1_FPA_Cash_Cost");
denominator = denominator + countNumItemsPartnerData(jsonPartner, "G_OUTPUT1/O1_FPA_001/O1_FPA_Cash_Actual");
denominator = denominator + countNumItemsPartnerData(jsonPartner, "G_OUTPUT1/O1_FPA_001/O1_FPA_Cash_Actual_Host");
if (denominator > 0) {
formatText(y2, 2, "Average value of cash grants per beneficiary per year for agricultural production", "Arimo", 15, "black", graphcolor, 8, graphcolor, "left", "0");
formatText(y2, 10, String(Math.round(((nominator * pexr) / denominator) * 100) / 100).replace(/(\d)(?=(\d{3})+(?!\d))/g, '$1,') + " USD", "Arimo", 18, "black", graphcolor, 2, graphcolor, "right", "bold");
y2++;
y2++;
cx++;
cx2++;
}
/*Average value of support to protect agricultural productive assets per beneficiary per year */
nominator = 0;
denominator = 0;
nominator = nominator + countNumItemsPartnerData(jsonPartner, "G_OUTPUT1/O1_MPPA1/O1_MPPA1_Cost");
denominator = denominator + countNumItemsPartnerData(jsonPartner, "G_OUTPUT1/O1_MPPA1/O1_MPPA1_Actual");
denominator = denominator + countNumItemsPartnerData(jsonPartner, "G_OUTPUT1/O1_MPPA1/O1_MPPA1_Actual_Host");
if (denominator > 0) {
formatText(y2, 2, "Average value of support to protect agricultural productive assets per beneficiary per year", "Arimo", 15, "black", graphcolor, 8, graphcolor, "left", "0");
formatText(y2, 10, String(Math.round(((nominator * pexr) / denominator) * 100) / 100).replace(/(\d)(?=(\d{3})+(?!\d))/g, '$1,') + " USD", "Arimo", 18, "black", graphcolor, 2, graphcolor, "right", "bold");
sumsheet.getRange(y2, 10).setNumberFormat('#,##0;[Red](#,##0)');
y2++;
y2++;
|
4.1 AGRICULTURAL EMPLOYMENT
1 2 3 4 5 6 7 8 9 10 | secondcropkg = table321[3][7];
secondcrophc = table321[3][8];
secondcropratio = Math.round(table321[3][2]);
secondcropnational = table301[3][6];
}
table3 = table321.concat();//CROP TABLE
/*generate the narrative for 4.2 AGRICULTURAL PRODUCTIVITY */
displayNarrativeIndicator42Farming(yy - 1, 9, h + 4, tnf);
}
}
|
4.1 AGRICULTURAL EMPLOYMENT > Narrative
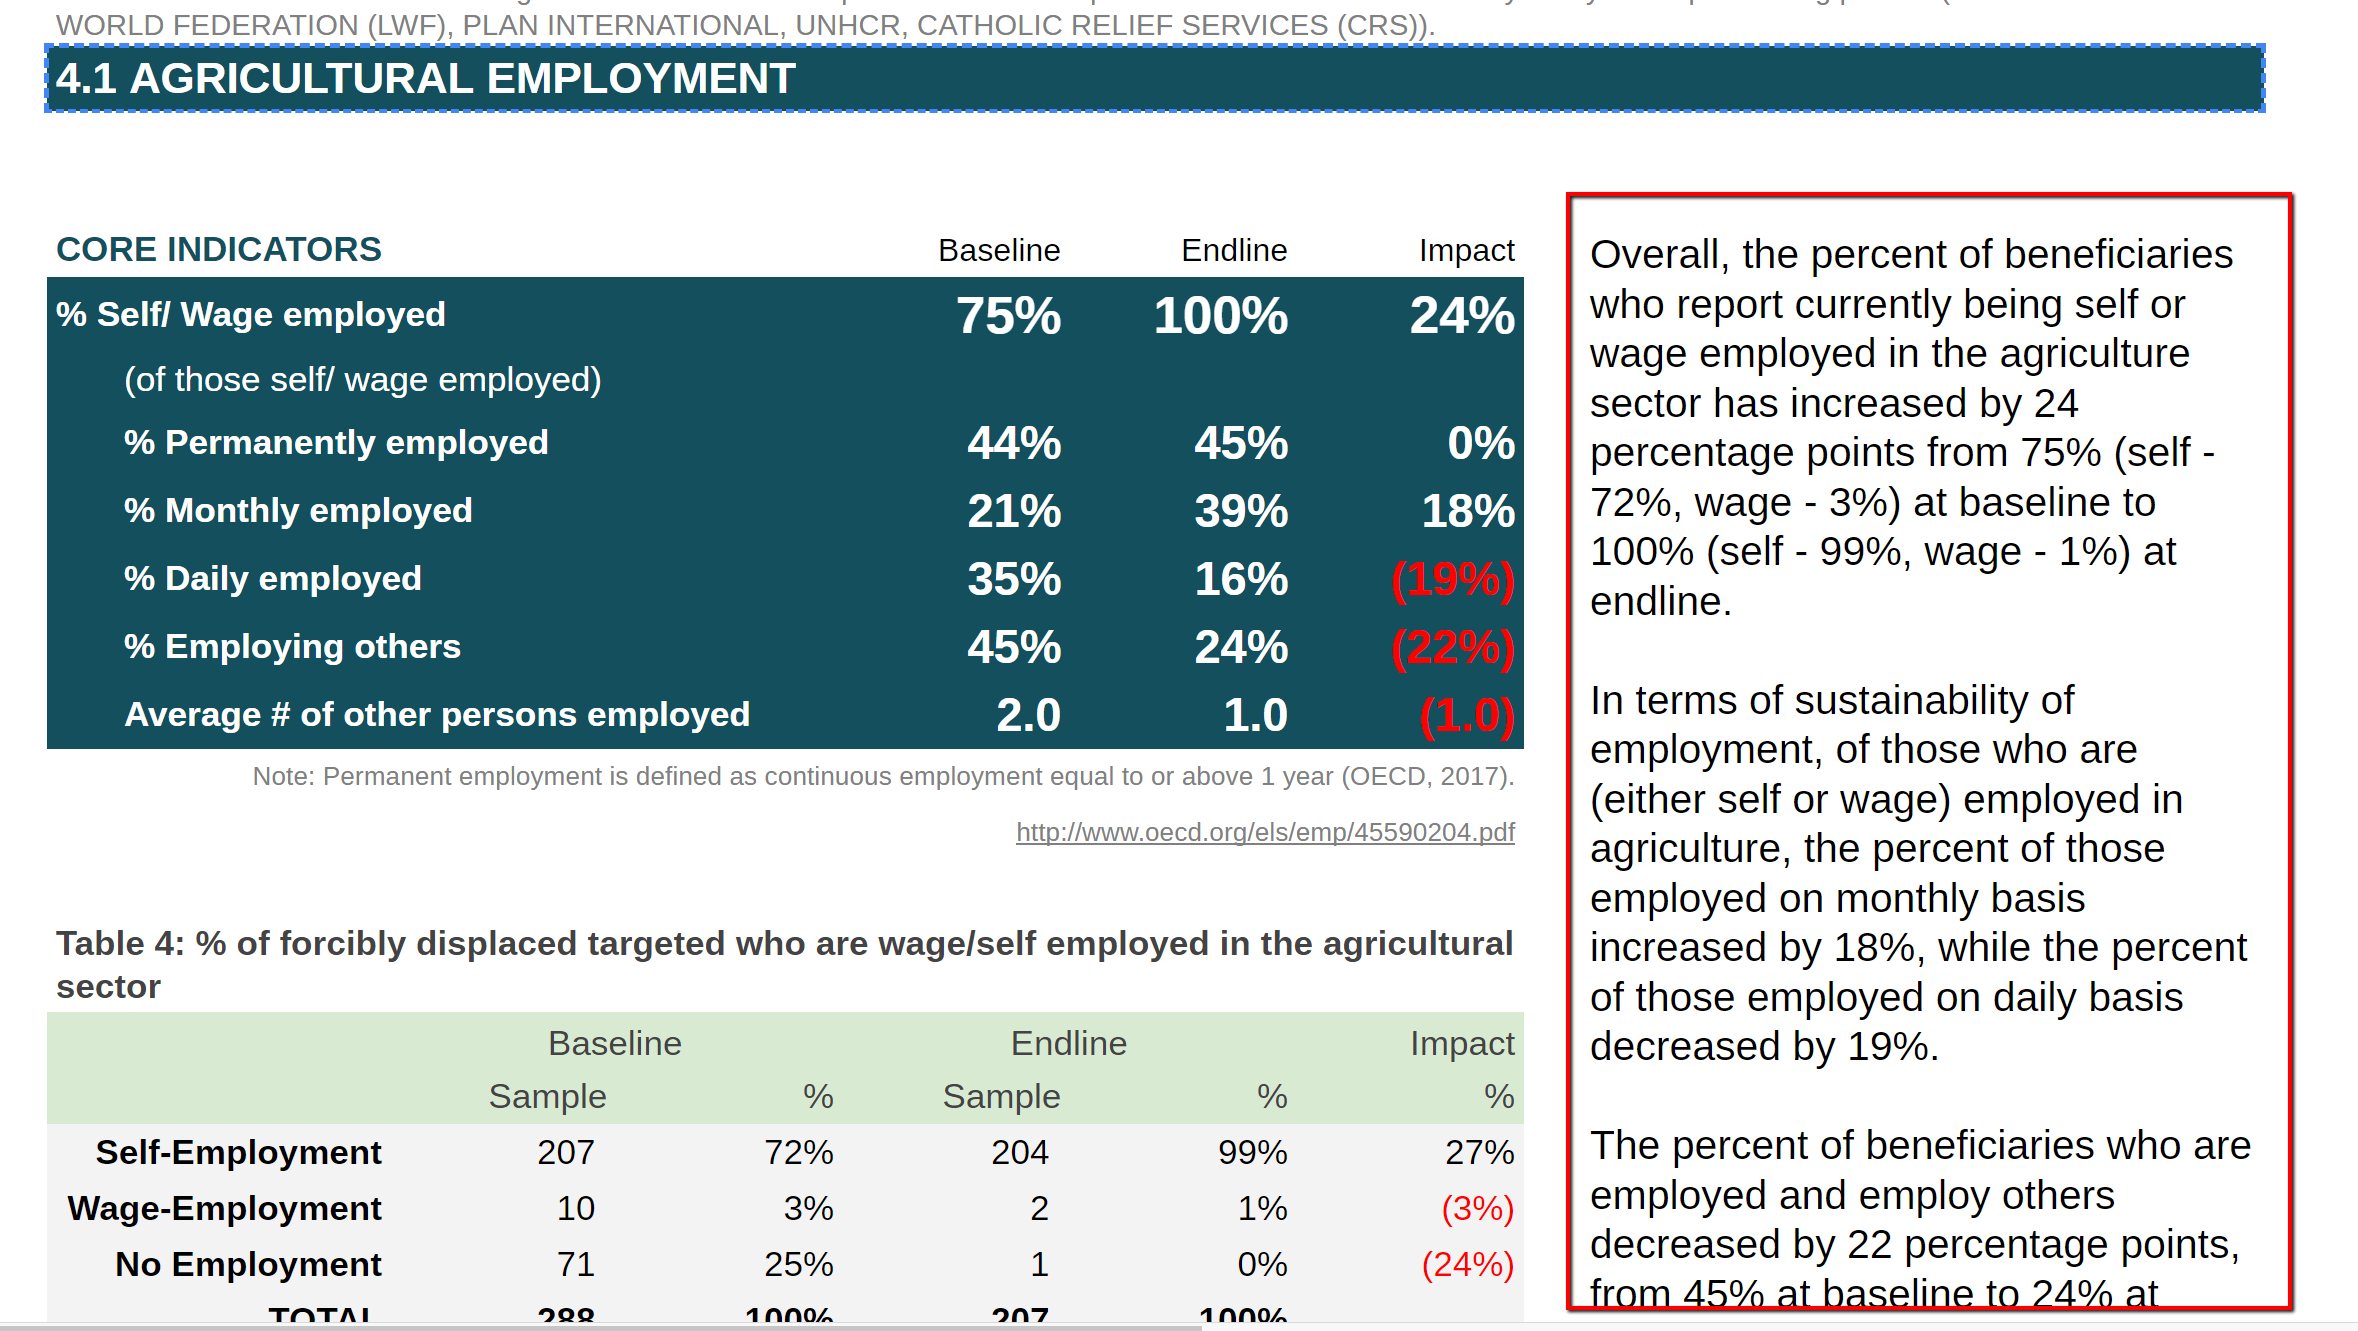
Screenshot of indicator
1 2 3 4 5 6 7 8 9 10 11 12 13 14 15 16 17 | if (cx > 0 && cx2 == 0) {
formatText(y2 - 1, 2, "Note: The information on the average amount of assistance provided has been provided at the end of the fiscal year by the implementing partner " + partnernamesp + ".", "Arimo", 10, "grey", "white", 10, "white", "left", "0");
y2++;
}
if (cx > 0 && cx2 > 0) {
formatText(y2 - 1, 2, "Note : The information on the average amount of assistance provided has been provided at the end of the fiscal year by the implementing partner " + partnernamesp + ".", "Arimo", 10, "grey", "white", 10, "white", "left", "0");
y2++;
}
}
}
/*4.1 AGRICULTURAL EMPLOYMENT*/
{
formatText(y2, 2, "4.1 AGRICULTURAL EMPLOYMENT", "Arimo", 15, "white", titlecolor, 10, titlecolor, "left", "bold");
y2++;
|
4.1 AGRICULTURAL EMPLOYMENT > Core Indicators
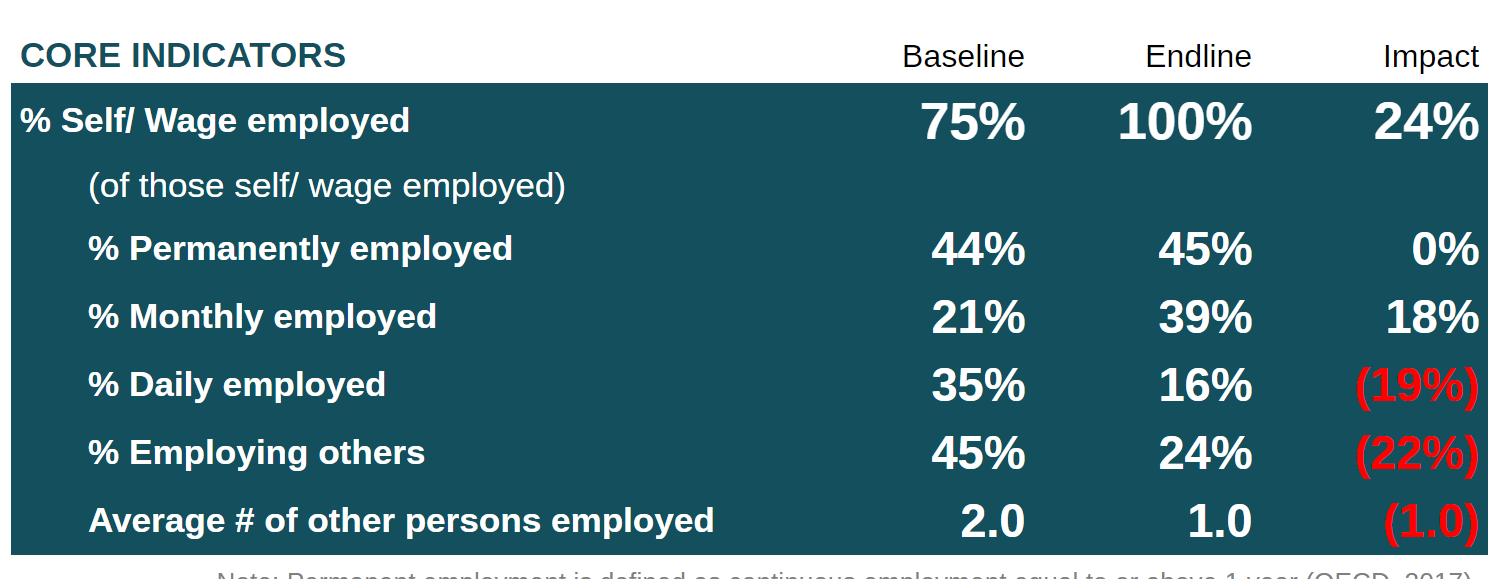
Screenshot of indicator
1 2 3 4 5 6 7 8 9 10 11 12 13 14 15 16 17 18 19 20 21 22 23 24 25 26 27 28 29 30 31 32 33 34 35 36 37 38 39 40 41 42 43 44 45 46 47 48 49 50 51 52 53 54 55 56 57 58 59 60 61 62 63 64 65 66 67 68 69 70 71 72 73 74 75 76 77 78 79 80 81 82 | formatTableHeader(y2);
y2++;
table = table301.concat();
table2 = table3101.concat();
table3 = table313.concat();
table4 = tableNumberOtherEmpl.concat();
/*generates the narrative for 4.1*/
displayNarrativeIndicator41a(y2 - 1, 9, 3);
table = table311.concat();;
table2 = tableNumberOtherEmpl.concat();;
/*generate the narrative for Employment2*/
ndisplayNarrativeIndicator41Agriculture(y2 - 1, 9, table311.length);
/*Core Indicators*/
formatText(y2, 2, "% Self/ Wage employed", "Arimo", 12, "white", titlecolor, 3, titlecolor, "left", "bold");
formatText(y2, 5, "", "Arimo", 18, "white", titlecolor, 1, titlecolor, "Right", "bold");
sumsheet.getRange(y2, 5).setValue(table3101[2][2] + table3101[3][2]);
formatText(y2, 6, " ", "Arimo", 18, "white", titlecolor, 1, titlecolor, "Right", "bold");
sumsheet.getRange(y2, 6).setValue(table3101[2][4] + table3101[3][4]);
formatText(y2, 7, " ", "Arimo", 18, "white", titlecolor, 1, titlecolor, "Right", "bold");
sumsheet.getRange(y2, 7).setValue(table3101[2][5] + table3101[3][5]);
y2++;
formatText(y2, 2, " (of those self/ wage employed)", "Arimo", 12, "white", titlecolor, 6, titlecolor, "left", "normal");
y2++;
formatText(y2, 2, " % Permanently employed", "Arimo", 12, "white", titlecolor, 3, titlecolor, "left", "bold");
formatText(y2, 5, "", "Arimo", 16, "white", titlecolor, 1, titlecolor, "Right", "bold");
sumsheet.getRange(y2, 5).setValue(table311[2][2] + table311[5][2]);
formatText(y2, 6, " ", "Arimo", 16, "white", titlecolor, 1, titlecolor, "Right", "bold");
sumsheet.getRange(y2, 6).setValue(table311[2][4] + table311[5][4]);
formatText(y2, 7, " ", "Arimo", 16, "white", titlecolor, 1, titlecolor, "Right", "bold");
sumsheet.getRange(y2, 7).setValue(table311[2][5] + table311[5][5]);
y2++;
formatText(y2, 2, " % Monthly employed", "Arimo", 12, "white", titlecolor, 3, titlecolor, "left", "bold");
formatText(y2, 5, " ", "Arimo", 16, "white", titlecolor, 1, titlecolor, "Right", "bold");
sumsheet.getRange(y2, 5).setValue(table311[3][2] + table311[6][2]);
formatText(y2, 6, " ", "Arimo", 16, "white", titlecolor, 1, titlecolor, "Right", "bold");
sumsheet.getRange(y2, 6).setValue(table311[3][4] + table311[6][4]);
formatText(y2, 7, " ", "Arimo", 16, "white", titlecolor, 1, titlecolor, "Right", "bold");
sumsheet.getRange(y2, 7).setValue(table311[3][5] + table311[6][5]);
y2++;
formatText(y2, 2, " % Daily employed", "Arimo", 12, "white", titlecolor, 3, titlecolor, "left", "bold");
formatText(y2, 5, " ", "Arimo", 16, "white", titlecolor, 1, titlecolor, "Right", "bold");
sumsheet.getRange(y2, 5).setValue(table311[4][2] + table311[7][2]);
formatText(y2, 6, " ", "Arimo", 16, "white", titlecolor, 1, titlecolor, "Right", "bold");
sumsheet.getRange(y2, 6).setValue(table311[4][4] + table311[7][4]);
formatText(y2, 7, " ", "Arimo", 16, "white", titlecolor, 1, titlecolor, "Right", "bold");
sumsheet.getRange(y2, 7).setValue(table311[4][5] + table311[7][5]);
y2++;
formatText(y2, 2, " % Employing others", "Arimo", 12, "white", titlecolor, 3, titlecolor, "left", "bold");
formatText(y2, 5, " ", "Arimo", 16, "white", titlecolor, 1, titlecolor, "Right", "bold");
sumsheet.getRange(y2, 5).setValue(table313[2][2]);
formatText(y2, 6, " ", "Arimo", 16, "white", titlecolor, 1, titlecolor, "Right", "bold");
sumsheet.getRange(y2, 6).setValue(table313[2][4]);
formatText(y2, 7, " ", "Arimo", 16, "white", titlecolor, 1, titlecolor, "Right", "bold");
sumsheet.getRange(y2, 7).setValue(table313[2][5]);
y2++;
sumsheet.getRange(y2 - 6, 5, 6, 3).setNumberFormat('0%;[Red](0%)');
formatText(y2, 2, " Average # of other persons employed", "Arimo", 12, "white", titlecolor, 3, titlecolor, "left", "bold");
formatText(y2, 5, " ", "Arimo", 16, "white", titlecolor, 1, titlecolor, "Right", "bold");
if (totaloutputbl != 0 && table313[2][2] != "") { sumsheet.getRange(y2, 5).setValue(Math.round((table4[6][1] / (totaloutputbl * table3101[2][2])) * 10) / 10); }
formatText(y2, 6, " ", "Arimo", 16, "white", titlecolor, 1, titlecolor, "Right", "bold");
formatText(y2, 7, " ", "Arimo", 16, "white", titlecolor, 1, titlecolor, "Right", "bold");
if (endline != 0 && table313[2][4] != "") {
sumsheet.getRange(y2, 6).setValue(Math.round((table4[6][3] / (totaloutputel * table3101[2][4])) * 10) / 10);
if (totaloutputbl > 0 && table313[2][2] != "") {
sumsheet.getRange(y2, 7).setValue(((Math.round((table4[6][3] / (totaloutputel * table3101[2][4])) * 10) / 10) - Math.round((table4[6][1] / (totaloutputbl * table3101[2][2])) * 10) / 10));
}
if (totaloutputbl > 0 && table313[2][2] == "") {
sumsheet.getRange(y2, 7).setValue(((Math.round((table4[6][3] / (totaloutputel * table3101[2][4])) * 10) / 10)));
}
}
sumsheet.getRange(y2, 5, 1, 3).setNumberFormat('#,##0.0;[Red](#,##0.0)');
y2++; y2++;
|
4.2 AGRICULTURAL PRODUCTIVITY
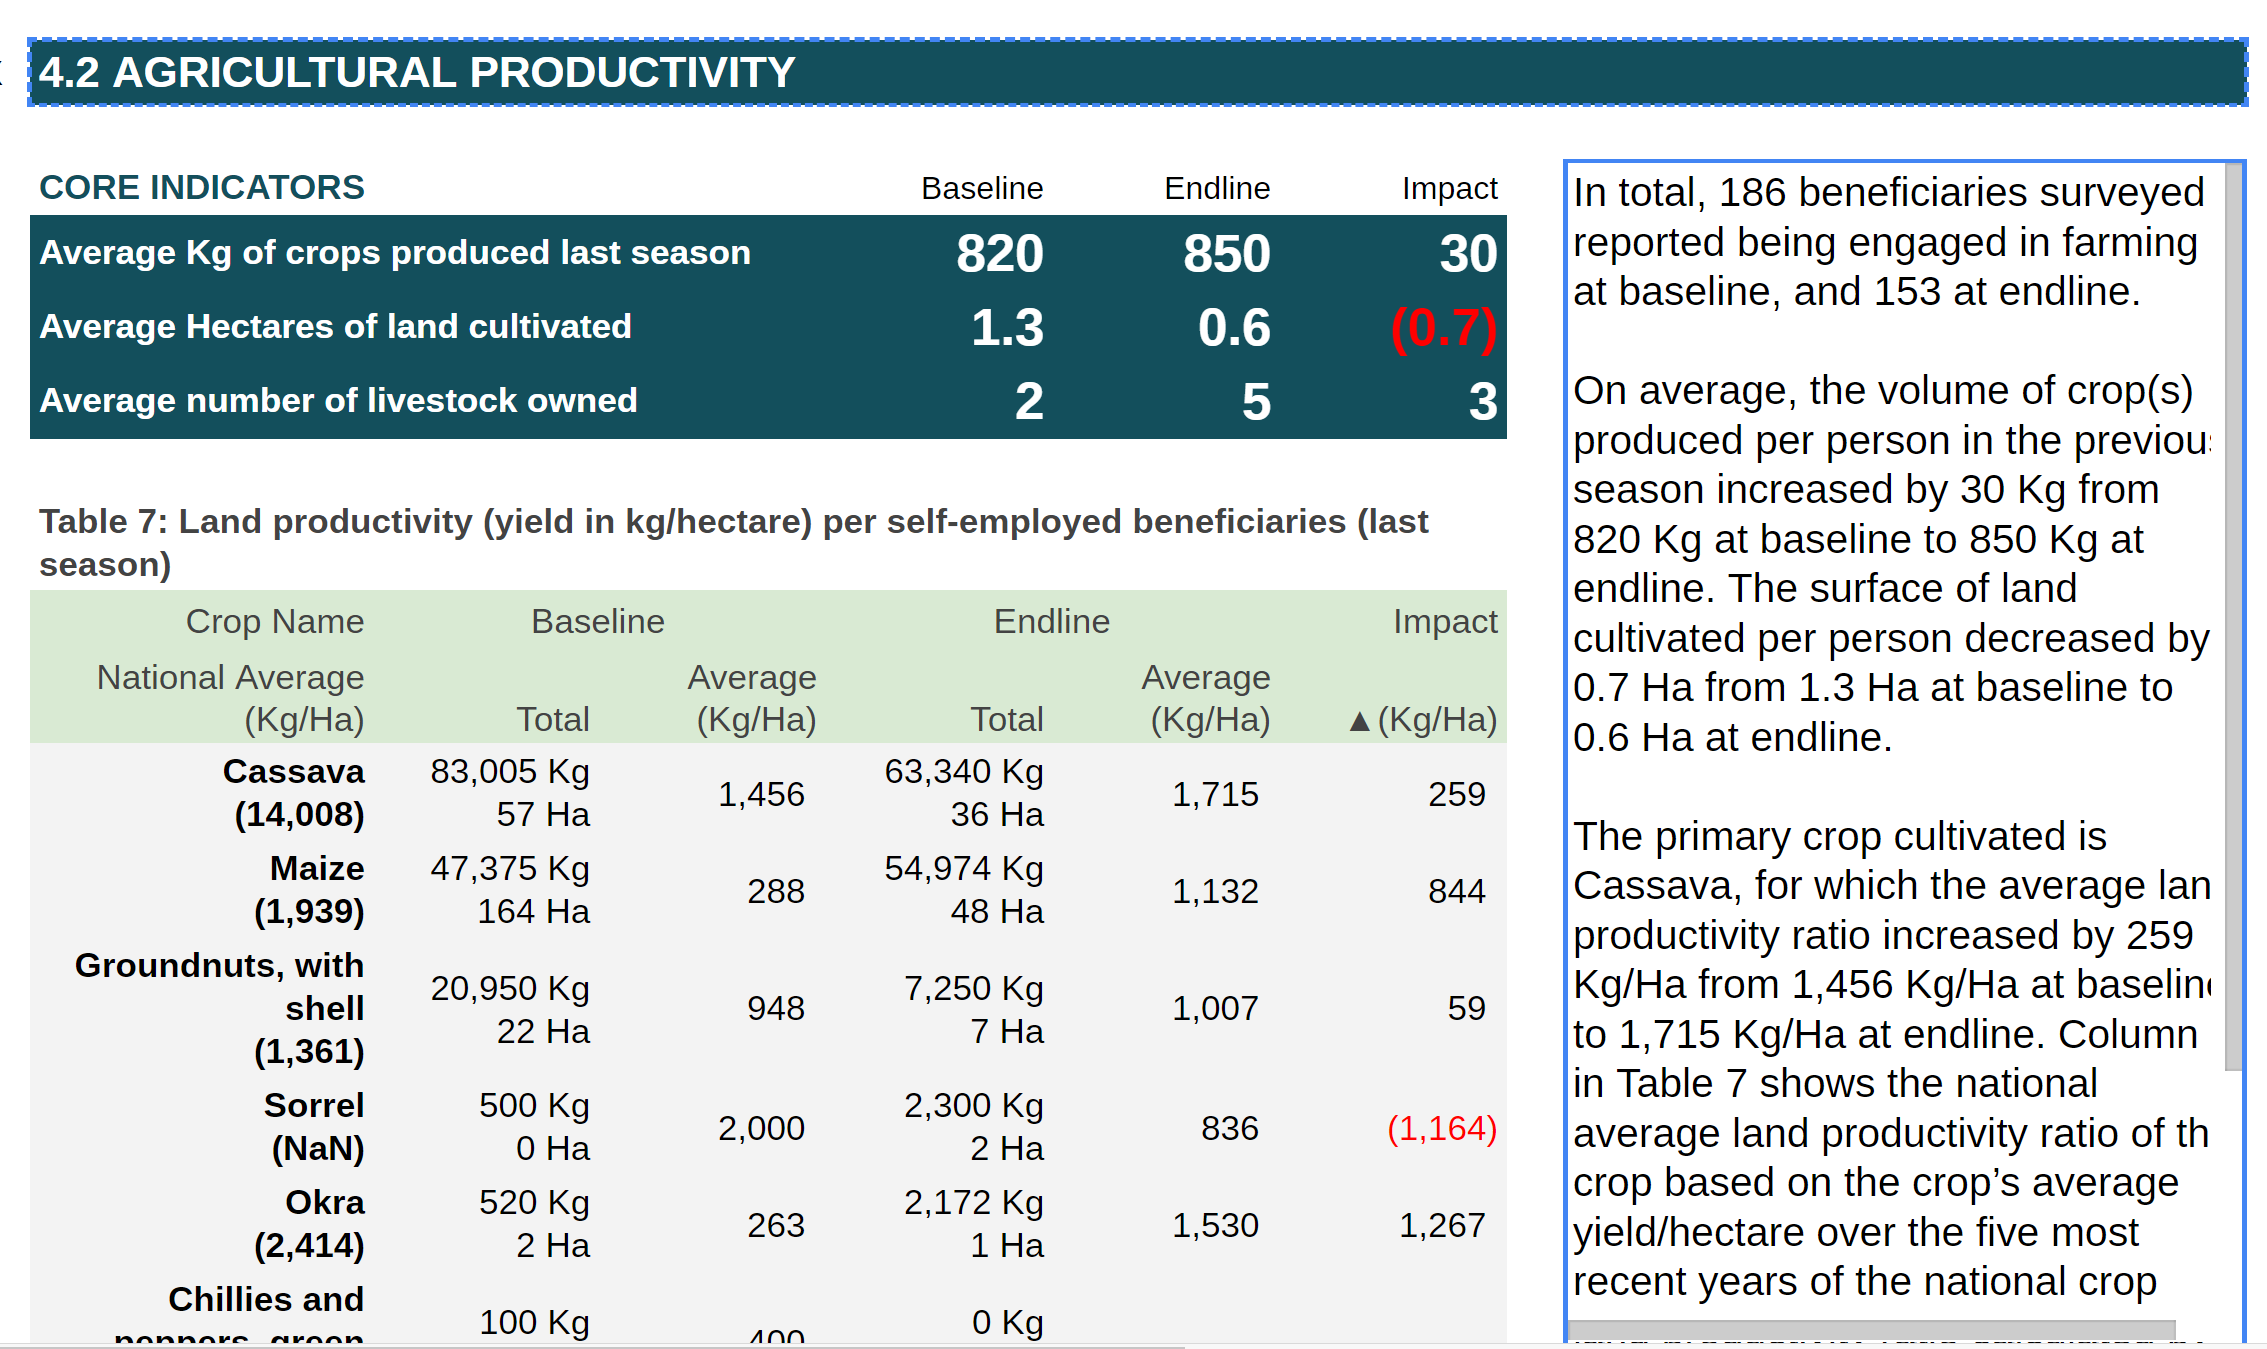
Screenshot of indicator
1 2 3 4 5 6 7 8 9 10 11 12 13 14 15 16 17 18 19 | formatNote(y2 - 1, 7, "Note: Permanent employment is defined as continuous employment equal to or above 1 year (OECD, 2017).");
y2++;
formatNote(y2 - 1, 7, "http://www.oecd.org/els/emp/45590204.pdf");
y2++;
/*Core indicators end**/
/*Table 4: % of forcibly displaced targeted who are wage/self employed in the agricultural sector */
tn++;
formatTables(y2, 2, table3101, 'Table ' + tn + ': % of forcibly displaced targeted who are wage/self employed in the agricultural sector',2);
/*Table 5: % of forcibly displaced targeted who are wage/self employed on a permanent / monthly / seasonal basis in the agricultural sector */
tn++;
/*formats the table*/
formatTables(y2, 2, table311, 'Table ' + tn + ': % of forcibly displaced targeted who are wage/self employed on a permanent / monthly / seasonal basis in the agricultural sector',2);
/*Table 6: Number of others employed by self-employed beneficiaries */
tn++;
formatTables(y2, 2, tableNumberOtherEmpl, 'Table ' + tn + ': Number of others employed by self-employed beneficiaries',2);
}
/*4.2 AGRICULTURAL PRODUCTIVITY */
{
|
4.2 AGRICULTURAL PRODUCTIVITY > Core indicators

Screenshot of indicator
1 2 3 4 5 6 7 8 9 10 11 12 13 14 15 16 17 18 19 20 21 22 23 24 25 26 27 28 29 30 31 32 33 34 | /*total number of beneficiaries involved in farming [Sub-Sector]*/
farmingtotal = countTotalNumCategoryIndicator2Agr(jsonData, 'G_OUTPUT1/O1_SubSector', ['Farming'], "ALL", "1");
/*1st Crop*/
zerofarmingtotal = countTotalNumCategoryIndicator2Agr(jsonData, 'G_OUTPUT1/O1_Crop_Production1/O1_1stCrop', ['0'], "ALL", "0");
/*total number of livestock owned*/
livestocktotal = countTotalNumCategoryIndicator2Agr(jsonData, 'G_OUTPUT1/O1_SubSector', ['Livestock'], "ALL", "1");
/*total number of beneficiaries engaged in fishering*/
fisherytotal = countTotalNumCategoryIndicator2Agr(jsonData, 'G_OUTPUT1/O1_SubSector', ['Fishery'], "ALL", "1");
}
formatText(y2, 2, "4.2 AGRICULTURAL PRODUCTIVITY", "Arimo", 15, "white", titlecolor, 10, titlecolor, "left", "bold");
y2++;
y2++;
/*Format the header of the tables*/
formatTableHeader(y2);
y2++;
/*Core Indicators */
{
yy = y2;
if (IndicatorYN('PRF1') == 1 && farmingtotal > 0) {
formatText(y2, 2, "Average Kg of crops produced last season", "Arimo", 12, "white", titlecolor, 3, titlecolor, "left", "bold");
formatText(y2, 5, " ", "Arimo", 18, "white", titlecolor, 1, titlecolor, "Right", "bold");
formatText(y2, 6, " ", "Arimo", 18, "white", titlecolor, 1, titlecolor, "Right", "bold");
formatText(y2, 7, " ", "Arimo", 18, "white", titlecolor, 1, titlecolor, "Right", "bold");
y2++;
formatText(y2, 2, "Average Hectares of land cultivated", "Arimo", 12, "white", titlecolor, 3, titlecolor, "left", "bold");
formatText(y2, 5, " ", "Arimo", 18, "white", titlecolor, 1, titlecolor, "Right", "bold");
formatText(y2, 6, " ", "Arimo", 18, "white", titlecolor, 1, titlecolor, "Right", "bold");
formatText(y2, 7, " ", "Arimo", 18, "white", titlecolor, 1, titlecolor, "Right", "bold");
y2++;
}
|
4.2 AGRICULTURAL PRODUCTIVITY > Table : Land productivity (yield in kg/hectare) per self-employed beneficiaries (last season)
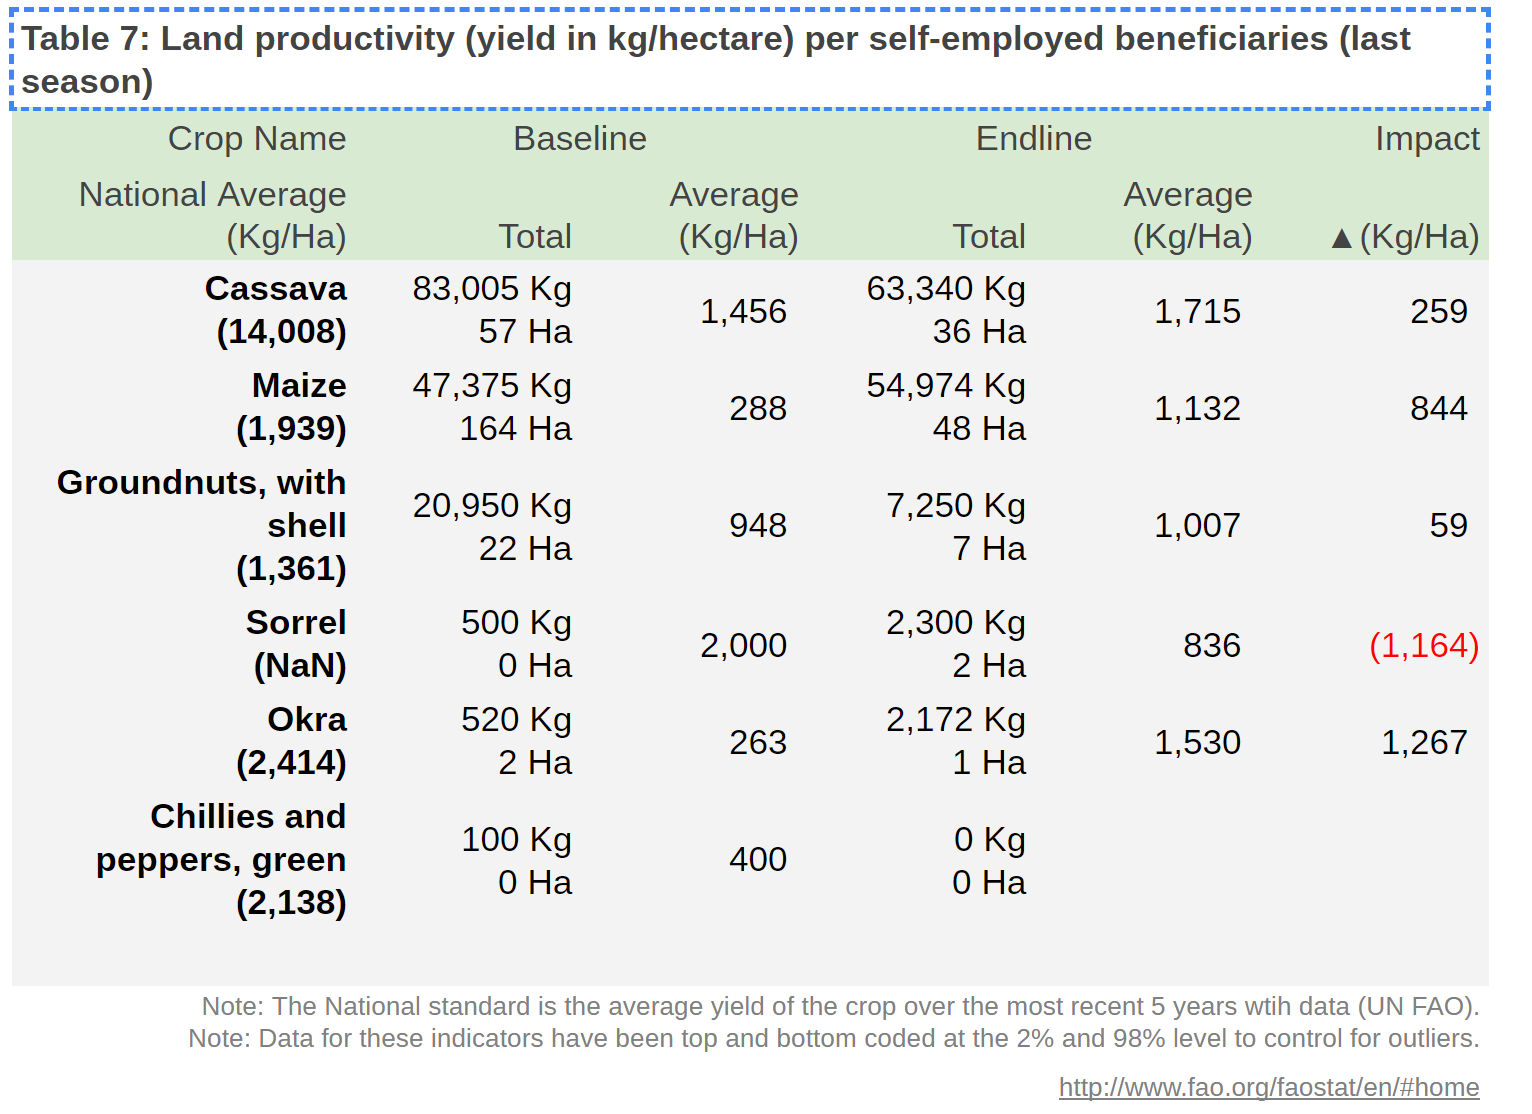
Screenshot of table
1 2 3 4 5 6 7 8 9 10 11 12 13 14 15 16 17 18 19 20 21 22 23 24 25 26 27 28 29 30 31 32 33 34 35 36 37 38 39 40 41 42 43 44 45 46 47 48 49 50 51 52 53 54 55 56 57 58 59 60 61 62 63 64 65 66 67 68 69 70 71 72 73 74 75 76 77 78 79 80 81 82 83 84 85 86 87 88 89 90 91 92 | formatText(y2, 5, " ", "Arimo", 18, "white", titlecolor, 1, titlecolor, "Right", "bold");
formatText(y2, 6, " ", "Arimo", 18, "white", titlecolor, 1, titlecolor, "Right", "bold");
formatText(y2, 7, " ", "Arimo", 18, "white", titlecolor, 1, titlecolor, "Right", "bold");
y2++;
}
if (IndicatorYN('PRFISH1') == 1 && fisherytotal > 0) {
formatText(y2, 2, "Average kg of fish produced", "Arimo", 12, "white", titlecolor, 3, titlecolor, "left", "bold");
formatText(y2, 5, " ", "Arimo", 18, "white", titlecolor, 1, titlecolor, "Right", "bold");
formatText(y2, 6, " ", "Arimo", 18, "white", titlecolor, 1, titlecolor, "Right", "bold");
formatText(y2, 7, " ", "Arimo", 18, "white", titlecolor, 1, titlecolor, "Right", "bold");
y2++;
}
y2++;
}
/*Table : Land productivity (yield in kg/hectare) per self-employed beneficiaries (last season) */
{
var h = 0;
var h2 = 0;
if (IndicatorYN('PRF1') == 1 && farmingtotal - zerofarmingtotal > 0) {
/*generates the value for table 7*/
var table321 = generateTableIndicator42AgrProduc(jsonData, ['G_OUTPUT1/O1_Crop_Production1/O1_1stCrop', 'G_OUTPUT1/O1_Crop_Production2/O1_2ndCrop'],
['Crop1KG', 'Crop2KG'],
['Crop1HA', 'Crop2HA'],
['G_OUTPUT1/O1_Crop_Production1/O1_1stCrop_Unit', 'G_OUTPUT1/O1_Crop_Production2/O1_2ndCrop_Unit'],
['G_OUTPUT1/O1_Crop_Production1/O1_1stCrop_Land_Unit', 'G_OUTPUT1/O1_Crop_Production2/O1_2ndCrop_Land_Unit']);
sortTable(table321, 7);
tn++;
var tnf = tn;
/*displays and formats the table 7*/
formatTables(y2, 2, table321, 'Table ' + tn + ': Land productivity (yield in kg/hectare) per self-employed beneficiaries (last season)',2);
/*formats and displays the note*/
formatNote(y2 - 1, 7, "Note: The National standard is the average yield of the crop over the most recent 5 years wtih data (UN FAO)." + String.fromCharCode(10) + "Note: Data for these indicators have been top and bottom coded at the 2% and 98% level to control for outliers.");
y2++;
formatNote(y2 - 1, 7, "http://www.fao.org/faostat/en/#home");
y2++;
sumsheet.getRange(y2 + table321.length, 11).setFontWeight("normal");
sumsheet.getRange(y2 + table321.length, 11).setFontSize(10);
sumsheet.getRange(y2 - table321.length - 2, 2, 1, 6).setVerticalAlignment("Bottom");
sumsheet.getRange(y2 - table321.length - 2, 2, table321.length + 2, 1).setWrap(true);
sumsheet.getRange(y2 - table321.length - 3, 8, table321.length + 2, 3).clear();
sumsheet.getRange(y2 - 2, 6, 1, 7).setFontWeight("normal");
h = h + table321.length + 2;
}
/*Table 8: Total number of animal owned by the self-employed beneficiaries*/
var yy2 = 0;
if (IndicatorYN('PRA1') == 1 && livestocktotal > 0) {
var table322 = generateTableIndicator42AgrProducAnimal(jsonData, ['G_OUTPUT1/O1_Animal_Production/Animal1', 'G_OUTPUT1/O1_Animal_Production/Animal2'],
['G_OUTPUT1/O1_Animal_Production/Animal_Owned', 'G_OUTPUT1/O1_Animal_Production/Animal_Owned2']);
sortTable(table322, 6);
yy2 = y2;
tn++;
/*Cleaned the table*/
for (tr = 1; tr < table322.length; tr++) {
table322[tr][1] = "";
table322[tr][3] = "";
}
table322[1][2] = "Average # owned by beneficiary";
table322[1][4] = "Average # owned by beneficiary";
table322[1][5] = "▲#";
/*format the table*/
formatTables(y2, 2, table322, 'Table ' + tn + ': Total number of animal owned by the self-employed beneficiaries',2);
formatNote(y2 - 1, 7, "Note: Data for these indicators have been top and bottom coded at the 2% and 98% level to control for outliers.");
y2++;
sumsheet.getRange(y2 - table322.length - 1, 2, 1, 6).setWrap(true);
sumsheet.getRange(y2 - table322.length - 1, 3, 1, 2).merge();
sumsheet.getRange(y2 - table322.length - 1, 5, 1, 2).merge();
sumsheet.getRange(y2 + table322.length, 6, 1, 6).clear();
sumsheet.getRange(y2 - table322.length - 2, 8, table322.length + 2, 2).clear();
sumsheet.getRange(y2 - 2, 2, 1, 7).setFontWeight("normal");
h2 = h2 + table322.length;
}
/*FISH*/
if (IndicatorYN('PRFISH1') == 1 && fisherytotal > 0) {
if (yy == 0) { yy2 = y2; }
/**/
var table323 = TablecountNumItemsIndicator42Agr(['Fish'], jsonData, ['G_OUTPUT1/O1_Fishery_Production/Fish_Owned'])
fishtotal = table323[2][1];
fishtotal2 = table323[2][3];
for (f = 2; f < table301.length; f++) {
if (table301[f][0] == "Fishery") {
fishbene = table301[f][1];
fishbene2 = table301[f][3];
}
}
|
4.2 AGRICULTURAL PRODUCTIVITY > Narrative
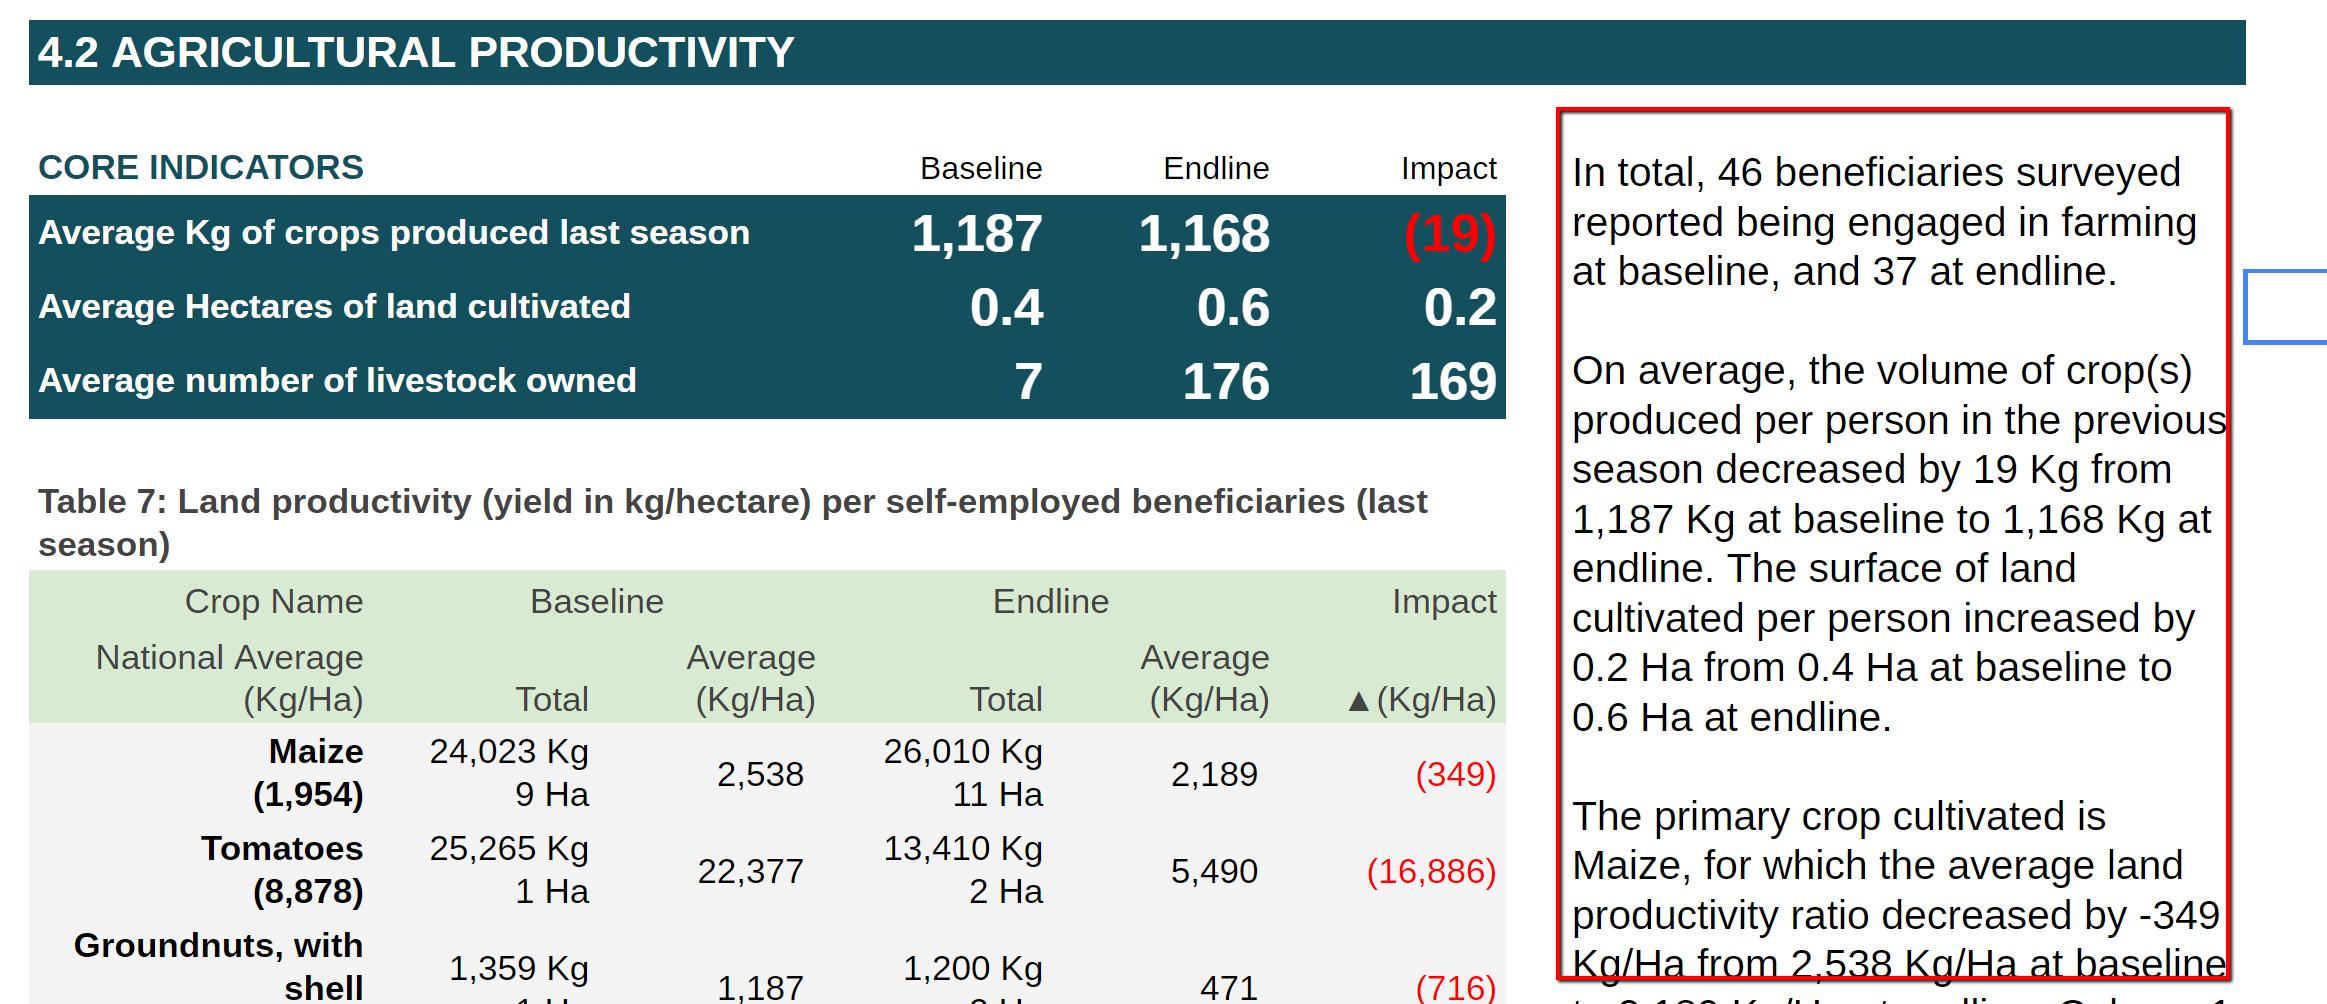
Screenshot of indicator
1 2 3 4 5 6 7 8 9 10 11 12 13 14 15 16 17 18 19 20 21 22 23 24 25 26 27 28 29 30 31 32 33 34 35 36 37 38 39 40 41 42 43 44 45 46 47 48 49 50 51 52 53 54 55 56 57 58 59 60 61 62 63 64 65 66 67 68 69 70 71 72 73 74 75 76 77 78 79 80 81 82 83 84 85 86 87 88 89 90 91 92 93 94 95 96 97 98 99 100 101 102 103 104 105 106 107 108 109 110 111 112 113 114 115 | table323[1][3] = "Total";
table323[1][4] = "Average";
table323[1][5] = "▲Kg";
table323[2][2] = Math.round(fishtotal / fishbene);
if (fishbene2 > 0) {
table323[2][4] = Math.round(table323[2][3] / fishbene2);
if (fishbene > 0) { table323[2][5] = Math.round(table323[2][4] - table323[2][2]); }
}
tn++;
formatTables(y2, 2, table323, 'Table ' + tn + ': Total Kg of fish produced',2);
sumsheet.getRange(y2 - 2, 2, 1, 6).clear();
h2 = h2 + table323.length;
}
}
/*narrative*/
{
/*OVERALL BENEFICIARY PER SUBSECTOR*/
table2 = table301.concat();
if (IndicatorYN('PRF1') == 1 && farmingtotal - zerofarmingtotal > 0) {
if (table321.length > 3) {
{
totalfaming = table301[2][1];
totalcropkg = String(bltotalkg).replace(/(\d)(?=(\d{3})+(?!\d))/g, '$1,');
totalcrophc = String(Math.round(bltotalhc)).replace(/(\d)(?=(\d{3})+(?!\d))/g, '$1,');
firstcrop = table321[2][0].splitCells("(");
firstcropkg = table321[2][7];
firstcrophc = table321[2][8];
firstcropratio = Math.round(table321[2][2]);
firstcropnational = table301[2][6];
secondcrop = table321[3][0].splitCells("(");
                                secondcropkg = table321[3][7];
                                secondcrophc = table321[3][8];
                                secondcropratio = Math.round(table321[3][2]);
                                secondcropnational = table301[3][6];
                            }
                            table3 = table321.concat();//CROP TABLE
                            /*generate the narrative for 4.2 AGRICULTURAL PRODUCTIVITY */
                            displayNarrativeIndicator42Farming(yy - 1, 9, h + 4, tnf);
                        }
                    }
if (yy2 != 0) {
if (IndicatorYN('PRFISH1') == 1 && fisherytotal > 0) {
table = table323.concat();
}
{
/*Average number of livestock owned*/
totalaveragelivestock = Math.round(blaverageanimal / blbene);
firstlivestock = table322[2][0].replace(",", "");
firsttotallivestock = table322[2][1];
firstaveragelivestock = table322[2][2];
var ff;
for (f = 2; f < table301.length; f++) {
if (table301[f][0] == "Livestock") {
ff = f;
}
}
totallivestock = table301[ff][1];
}
table3 = table322.concat();
/*generates the narrative for livestock and fish*/
displayNarrativeIndicator42Livestock(yy2, 9, h2, tn);
}
}
/*filling the core indicators table*/
{
if (farmingtotal - zerofarmingtotal > 0) {
if (bltotalhc > 0) {
formatText(yy, 5, Math.round(bltotalkg / table301[2][1]), "Arimo", 18, "white", titlecolor, 1, titlecolor, "Right", "bold");
}
if (eltotalhc > 0) {
formatText(yy, 6, Math.round(eltotalkg / table301[2][3]), "Arimo", 18, "white", titlecolor, 1, titlecolor, "Right", "bold");
}
if (eltotalhc > 0 && bltotalhc > 0) {
formatText(yy, 7, Math.round(eltotalkg / table301[2][3] - bltotalkg / table301[2][1]), "Arimo", 18, "white", titlecolor, 1, titlecolor, "Right", "bold");
}
sumsheet.getRange(yy, 5, 1, 3).setNumberFormat('#,##0;[Red](#,##0)');
yy++;
if (bltotalhc > 0) {
formatText(yy, 5, Math.round(bltotalhc / table301[2][1] * 10) / 10, "Arimo", 18, "white", titlecolor, 1, titlecolor, "Right", "bold");
}
if (eltotalhc > 0) {
formatText(yy, 6, String(Math.round(eltotalhc / table301[2][3] * 10) / 10), "Arimo", 18, "white", titlecolor, 1, titlecolor, "Right", "bold");
}
if (eltotalhc > 0 && bltotalhc > 0) {
formatText(yy, 7, String(Math.round((eltotalhc / table301[2][3] - bltotalhc / table301[2][1]) * 10) / 10), "Arimo", 18, "white", titlecolor, 1, titlecolor, "Right", "bold");
}
sumsheet.getRange(yy, 5, 1, 3).setNumberFormat('#,##0.0;[Red](#,##0.0)');
yy++;
}
if (farmingtotal - zerofarmingtotal == 0 && farmingtotal > 0) {
yy++;
yy++;
}
if (livestocktotal > 0) {
var blav = Math.round(blaverageanimal / blbene);
var elav = Math.round(elavarageanimal / elbene);
if (blbene > 0) {
formatText(yy, 5, blav, "Arimo", 18, "white", titlecolor, 1, titlecolor, "Right", "bold");
}
if (elbene > 0) {
formatText(yy, 6, elav, "Arimo", 18, "white", titlecolor, 1, titlecolor, "Right", "bold");
}
if (blbene > 0 && elbene > 0) {
formatText(yy, 7, (elav - blav), "Arimo", 18, "white", titlecolor, 1, titlecolor, "Right", "bold");
|
4.3 INCOME/SAVING GAINED FROM AGRICULTURE
1 2 3 4 5 6 7 8 9 10 11 12 13 14 15 16 | }
if (fisherytotal > 0) {
yy++;
if (fishbene > 0) {
formatText(yy, 5, Math.round(fishtotal / fishbene), "Arimo", 18, "white", titlecolor, 1, titlecolor, "Right", "bold");
}
if (fishbene2 > 0) {
formatText(yy, 6, Math.round(fishtotal2 / fishbene2), "Arimo", 18, "white", titlecolor, 1, titlecolor, "Right", "bold");
if (fishbene > 0) { formatText(yy, 7, Math.round((fishtotal2 / fishbene2) - (fishtotal / fishbene)), "Arimo", 18, "white", titlecolor, 1, titlecolor, "Right", "bold"); }
}
sumsheet.getRange(yy, 5, 1, 3).setNumberFormat('#,##0;[Red](#,##0)');
}
}
}
|
4.3 INCOME/SAVING GAINED FROM AGRICULTURE > Core indicators
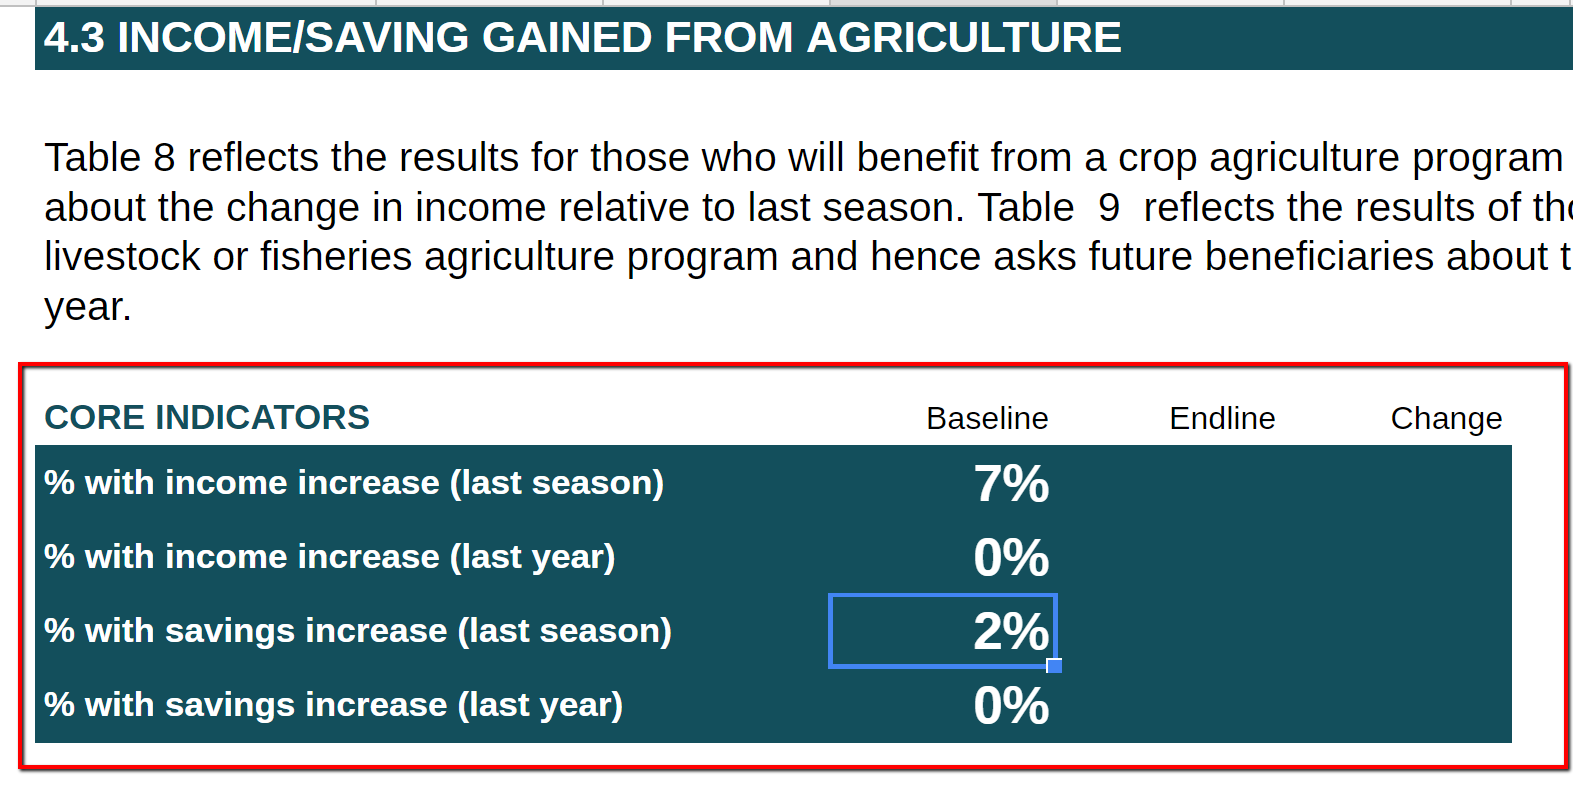
Screenshot of indicator
1 2 3 4 5 6 7 8 9 10 11 12 13 14 15 16 17 18 19 20 21 22 23 24 25 26 27 28 29 30 31 32 33 34 35 36 37 38 39 40 41 42 43 44 45 46 47 48 49 50 51 52 53 54 55 56 57 58 59 60 61 62 | var yy0 = 0;
formatText(y2, 2, "4.3 INCOME/SAVING GAINED FROM AGRICULTURE", "Arimo", 15, "white", titlecolor, 10, titlecolor, "left", "bold");
y2++;
y2++;
/**Count data for table. % of forcibly displaced targeted who self-report (decreased/maintained/increased) income compared to previous season */
if (IndicatorYN('PRF1') == 1 && countTotalNumCategoryIndicator2Agr(jsonData, 'G_OUTPUT1/O1_IncomeSaving/O1_Income', [['Decreased'], ['Same'], ['Increased']], "ALL", "1") > 0) {
yy0 = y2;
y2++;
y2++;
}
/*fomaters the header of the table*/
formatTableHeader(y2);
sumsheet.getRange(y2, 7).setValue("Change");
y2++;
yy = y2;
/*Core indicators*/
/*% with income increase (last season)*/
if (IndicatorYN('PRF1') == 1 && farmingtotal - zerofarmingtotal > 0) {
formatText(y2, 2, "% with income increase (last season)", "Arimo", 12, "white", titlecolor, 3, titlecolor, "left", "bold");
var table331 = generateTablePercentIndicatorImpactChange([['Increased'], ['Same'], ['Decreased']], ['Increased', 'Same', 'Decreased'], jsonData, ['G_OUTPUT1/O1_IncomeSaving/O1_IncomeF'], "No");
formatText(y2, 5, " ", "Arimo", 18, "white", titlecolor, 1, titlecolor, "Right", "bold");
sumsheet.getRange(y2, 5).setValue(table331[2][2]);
formatText(y2, 6, " ", "Arimo", 18, "white", titlecolor, 1, titlecolor, "Right", "bold");
sumsheet.getRange(y2, 6).setValue(table331[2][4]);
formatText(y2, 7, " ", "Arimo", 18, "white", titlecolor, 1, titlecolor, "Right", "bold");
sumsheet.getRange(y2, 7).setValue(table331[2][5]);
sumsheet.getRange(y2, 5, 1, 3).setNumberFormat('0%;[Red](0%)');
y2++;
table = table331.concat();
}
/*% with income increase (last year)*/
if (countTotalNumCategoryIndicator2Agr(jsonData, 'G_OUTPUT1/O1_IncomeSaving/O1_Income', [['Decreased'], ['Same'], ['Increased']], "ALL", "1") > 0) {
formatText(y2, 2, "% with income increase (last year)", "Arimo", 12, "white", titlecolor, 3, titlecolor, "left", "bold");
var table332 = generateTablePercentIndicatorImpactChange([['Increased'], ['Same'], ['Decreased']], ['Increased', 'Same', 'Decreased'], jsonData, ['G_OUTPUT1/O1_IncomeSaving/O1_Income'], "No");
formatText(y2, 5, " ", "Arimo", 18, "white", titlecolor, 1, titlecolor, "Right", "bold");
sumsheet.getRange(y2, 5).setValue(table332[2][2]);
formatText(y2, 6, " ", "Arimo", 18, "white", titlecolor, 1, titlecolor, "Right", "bold");
sumsheet.getRange(y2, 6).setValue(table332[2][4]);
formatText(y2, 7, " ", "Arimo", 18, "white", titlecolor, 1, titlecolor, "Right", "bold");
sumsheet.getRange(y2, 7).setValue(table332[2][5]);
sumsheet.getRange(y2, 5, 1, 3).setNumberFormat('0%;[Red](0%)');
y2++;
table2 = table332.concat();
}
/*% with savings increase (last season) */
if (IndicatorYN('PRF1') == 1 && farmingtotal - zerofarmingtotal > 0) {
formatText(y2, 2, "% with savings increase (last season)", "Arimo", 12, "white", titlecolor, 3, titlecolor, "left", "bold");
var table333 = generateTablePercentIndicatorImpactChange([['Increased'], ['Same'], ['Decreased']], ['Increased', 'Same', 'Decreased'], jsonData, ['G_OUTPUT1/O1_IncomeSaving/O1_SavingF'], "No");
formatText(y2, 5, " ", "Arimo", 18, "white", titlecolor, 1, titlecolor, "Right", "bold");
sumsheet.getRange(y2, 5).setValue(table333[2][2]);
formatText(y2, 6, " ", "Arimo", 18, "white", titlecolor, 1, titlecolor, "Right", "bold");
sumsheet.getRange(y2, 6).setValue(table333[2][4]);
formatText(y2, 7, " ", "Arimo", 18, "white", titlecolor, 1, titlecolor, "Right", "bold");
sumsheet.getRange(y2, 7).setValue(table333[2][5]);
sumsheet.getRange(y2, 5, 1, 3).setNumberFormat('0%;[Red](0%)');
y2++;
|
4.3 INCOME/SAVING GAINED FROM AGRICULTURE > Table: % of forcibly displaced targeted who self-report (decreased/maintained/increased) income compared to previous season
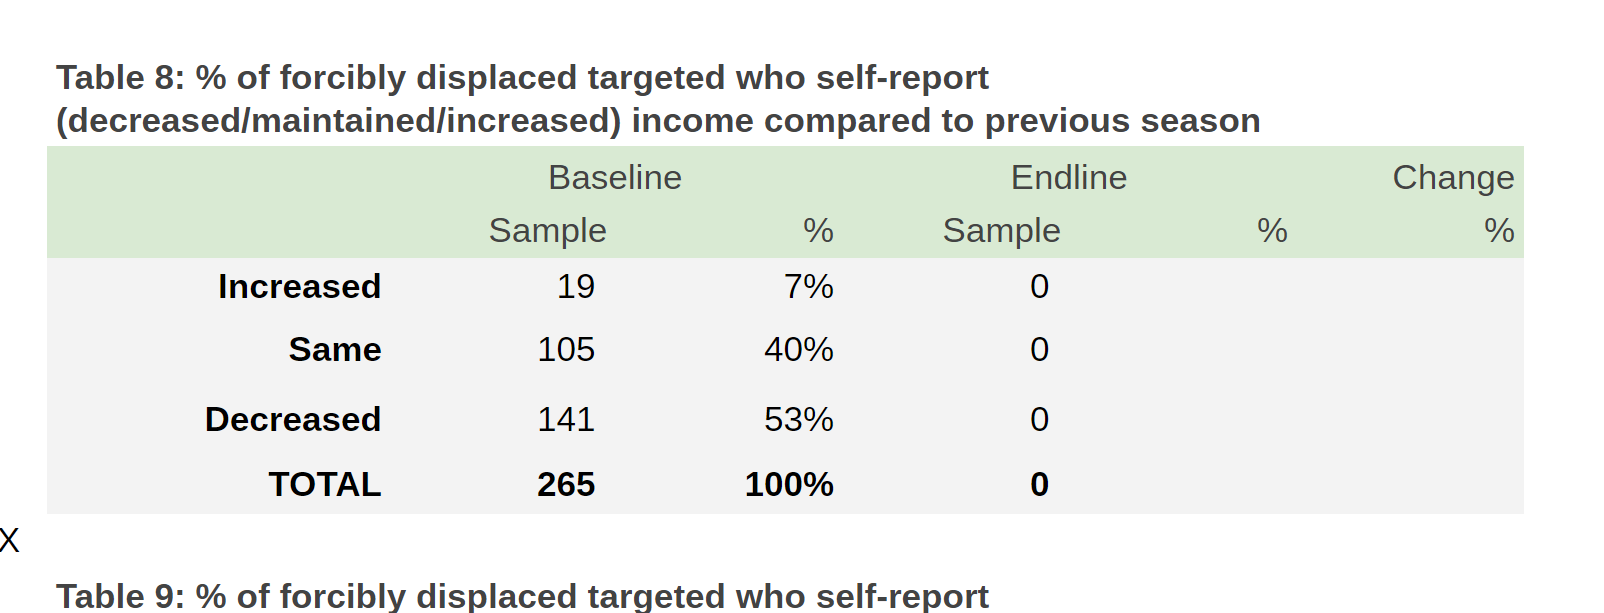
Screenshot of table
1 2 3 4 5 6 7 8 9 10 11 12 13 14 15 | /*% with savings increase (last year)*/
if (countTotalNumCategoryIndicator2Agr(jsonData, 'G_OUTPUT1/O1_IncomeSaving/O1_Income', [['Decreased'], ['Same'], ['Increased']], "ALL", "1") > 0) {
formatText(y2, 2, "% with savings increase (last year)", "Arimo", 12, "white", titlecolor, 3, titlecolor, "left", "bold");
var table334 = generateTablePercentIndicatorImpactChange([['Increased'], ['Same'], ['Decreased']], ['Increased', 'Same', 'Decreased'], jsonData, ['G_OUTPUT1/O1_IncomeSaving/O1_Saving'], "No");
formatText(y2, 5, " ", "Arimo", 18, "white", titlecolor, 1, titlecolor, "Right", "bold");
sumsheet.getRange(y2, 5).setValue(table334[2][2]);
formatText(y2, 6, " ", "Arimo", 18, "white", titlecolor, 1, titlecolor, "Right", "bold");
sumsheet.getRange(y2, 6).setValue(table334[2][4]);
formatText(y2, 7, " ", "Arimo", 18, "white", titlecolor, 1, titlecolor, "Right", "bold");
sumsheet.getRange(y2, 7).setValue(table334[2][5]);
sumsheet.getRange(y2, 5, 1, 3).setNumberFormat('0%;[Red](0%)');
y2++;
table4 = table334.concat();
}
|
4.3 INCOME/SAVING GAINED FROM AGRICULTURE > Table: % of forcibly displaced targeted who self-report (decreased/maintained/increased) income compared to previous year
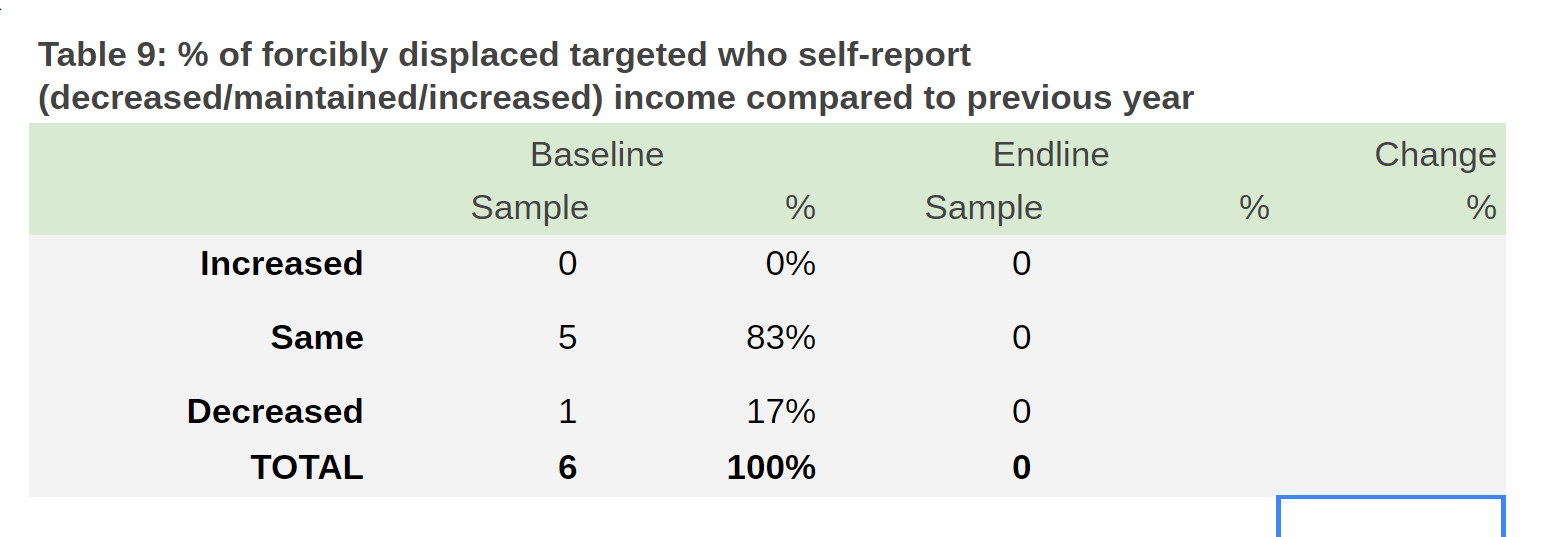
Screenshot of table
1 2 3 4 5 6 7 8 9 10 11 12 13 14 | /*Table: % of forcibly displaced targeted who self-report (decreased/maintained/increased) income compared to previous season */
if (IndicatorYN('PRF1') == 1 && farmingtotal - zerofarmingtotal > 0) {
tn++;
formatTables(y2, 2, table331, 'Table ' + tn + ': % of forcibly displaced targeted who self-report (decreased/maintained/increased) income compared to previous season',2);
if (totaloutputel > 0) {
incomeseason = table331[2][4];
incomeseasond = table331[4][4];
}
else {
incomeseason = table331[2][2];
incomeseasond = table331[4][2];
}
|
4.3 INCOME/SAVING GAINED FROM AGRICULTURE > Table: % of forcibly displaced targeted who self-report (decreased/maintained/increased) income compared to previous year
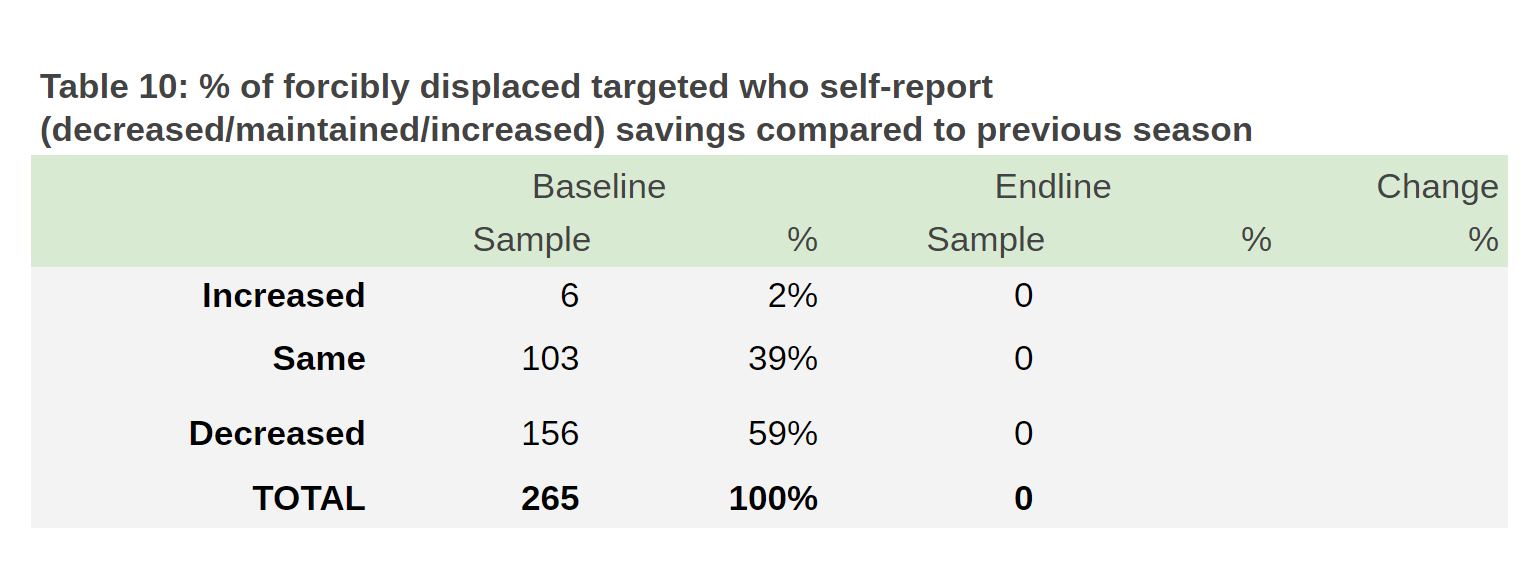
Screenshot of table
1 2 3 4 5 6 7 8 9 10 11 12 13 14 15 16 17 18 19 | }
/*Table: % of forcibly displaced targeted who self-report (decreased/maintained/increased) income compared to previous year*/
if (countTotalNumCategoryIndicator2Agr(jsonData, 'G_OUTPUT1/O1_IncomeSaving/O1_Income', [['Decreased'], ['Same'], ['Increased']], "ALL", "1") > 0) {
tn++;
formatTables(y2, 2, table332, 'Table ' + tn + ': % of forcibly displaced targeted who self-report (decreased/maintained/increased) income compared to previous year',2);
if (totaloutputel > 0) {
incomeyear = table332[2][4];
incomeyeard = table332[4][4];
}
else {
incomeyear = table332[2][2];
incomeyeard = table332[4][2];
}
formatGraphArrow(y2 - 7, 9, incomeyear, 1 - incomeyear - incomeyeard, incomeyeard, "income");
}
var yy2 = y2;
|
4.3 INCOME/SAVING GAINED FROM AGRICULTURE > Table: % of forcibly displaced targeted who self-report (decreased/maintained/increased) savings compared to previous year
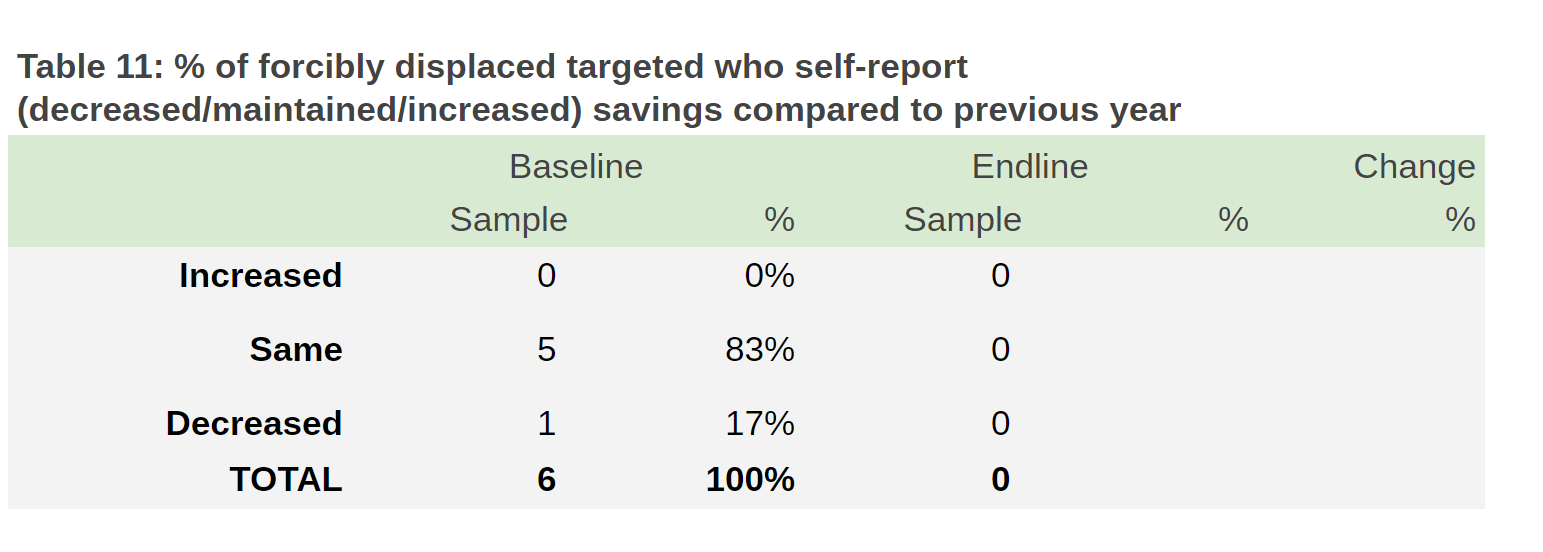
Screenshot of table
1 2 3 4 5 6 7 8 9 10 11 12 13 14 15 16 17 18 19 20 21 22 23 24 25 26 27 28 29 | if (IndicatorYN('PRF1') == 1 && farmingtotal - zerofarmingtotal > 0) {
tn++;
formatTables(y2, 2, table333, 'Table ' + tn + ': % of forcibly displaced targeted who self-report (decreased/maintained/increased) savings compared to previous season',2);
if (totaloutputel > 0) {
savingseason = table333[2][4];
savingseasond = table333[4][4];
}
else {
savingseason = table333[2][2];
savingseasond = table333[4][2];
}
formatGraphArrow(y2 - 7, 9, savingseason, 1 - savingseason - savingseasond, savingseasond, "saving");
}
/*Table: % of forcibly displaced targeted who self-report (decreased/maintained/increased) savings compared to previous year*/
if (countTotalNumCategoryIndicator2Agr(jsonData, 'G_OUTPUT1/O1_IncomeSaving/O1_Income', [['Decreased'], ['Same'], ['Increased']], "ALL", "1") > 0) {
tn++;
formatTables(y2, 2, table334, 'Table ' + tn + ': % of forcibly displaced targeted who self-report (decreased/maintained/increased) savings compared to previous year',2);
if (totaloutputel > 0) {
savingyear = table334[2][4];
savingyeard = table334[4][4];
}
else {
savingyear = table334[2][2];
savingyeard = table334[4][2];
}
|
Function displayLabelIndicator4Ouput1
-
displayLabelIndicator4Ouput1(x, y)¶ The function generates label “Multiple response for benefeciary” for 4. OUTPUT 1: ACCESS TO AGRICULTURE PRODUCTION ENHANCED ; 5. OUTPUT 2: ACCESS TO SELF-EMPLOYMENT FACILITATED
- Arguments
x (string) – column
y (string) – row
1 2 3 4 5 6 | function displayLabelIndicator4Ouput1(y, x) {
sumsheet.getRange(y - 1, 7).setValue("(Multiple response per beneficiary)");
sumsheet.getRange(y - 1, 7).setFontSize(9);
sumsheet.getRange(y - 1, 7).setFontColor("grey");
sumsheet.getRange(y - 1, 7).setHorizontalAlignment("right");
}
|
Function formatTableHeader
-
formatTableHeader(y)¶ The function formates the table header
- Arguments
y (string) – row
1 2 3 4 5 6 | function formatTableHeader(y) {
formatText(y, 2, "CORE INDICATORS", "Arimo", 12, titlecolor, "white", 2, "white", "Left", "bold");
formatText(y, 5, "Baseline", "Arimo", 11, "black", "white", 1, "white", "right", "0");
formatText(y, 6, "Endline", "Arimo", 11, "black", "white", 1, "white", "right", "0");
formatText(y, 7, "Impact", "Arimo", 11, "black", "white", 1, "white", "right", "0")
}
|
Function displayDataIndicator5Output2
-
displayDataIndicator5Output2()¶ The function generates and displays data for 5. OUTPUT 2: ACCESS TO SELF-EMPLOYMENT FACILITATED
OUTPUT2 >5. OUTPUT 2: ACCESS TO SELF-EMPLOYMENT FACILITATED
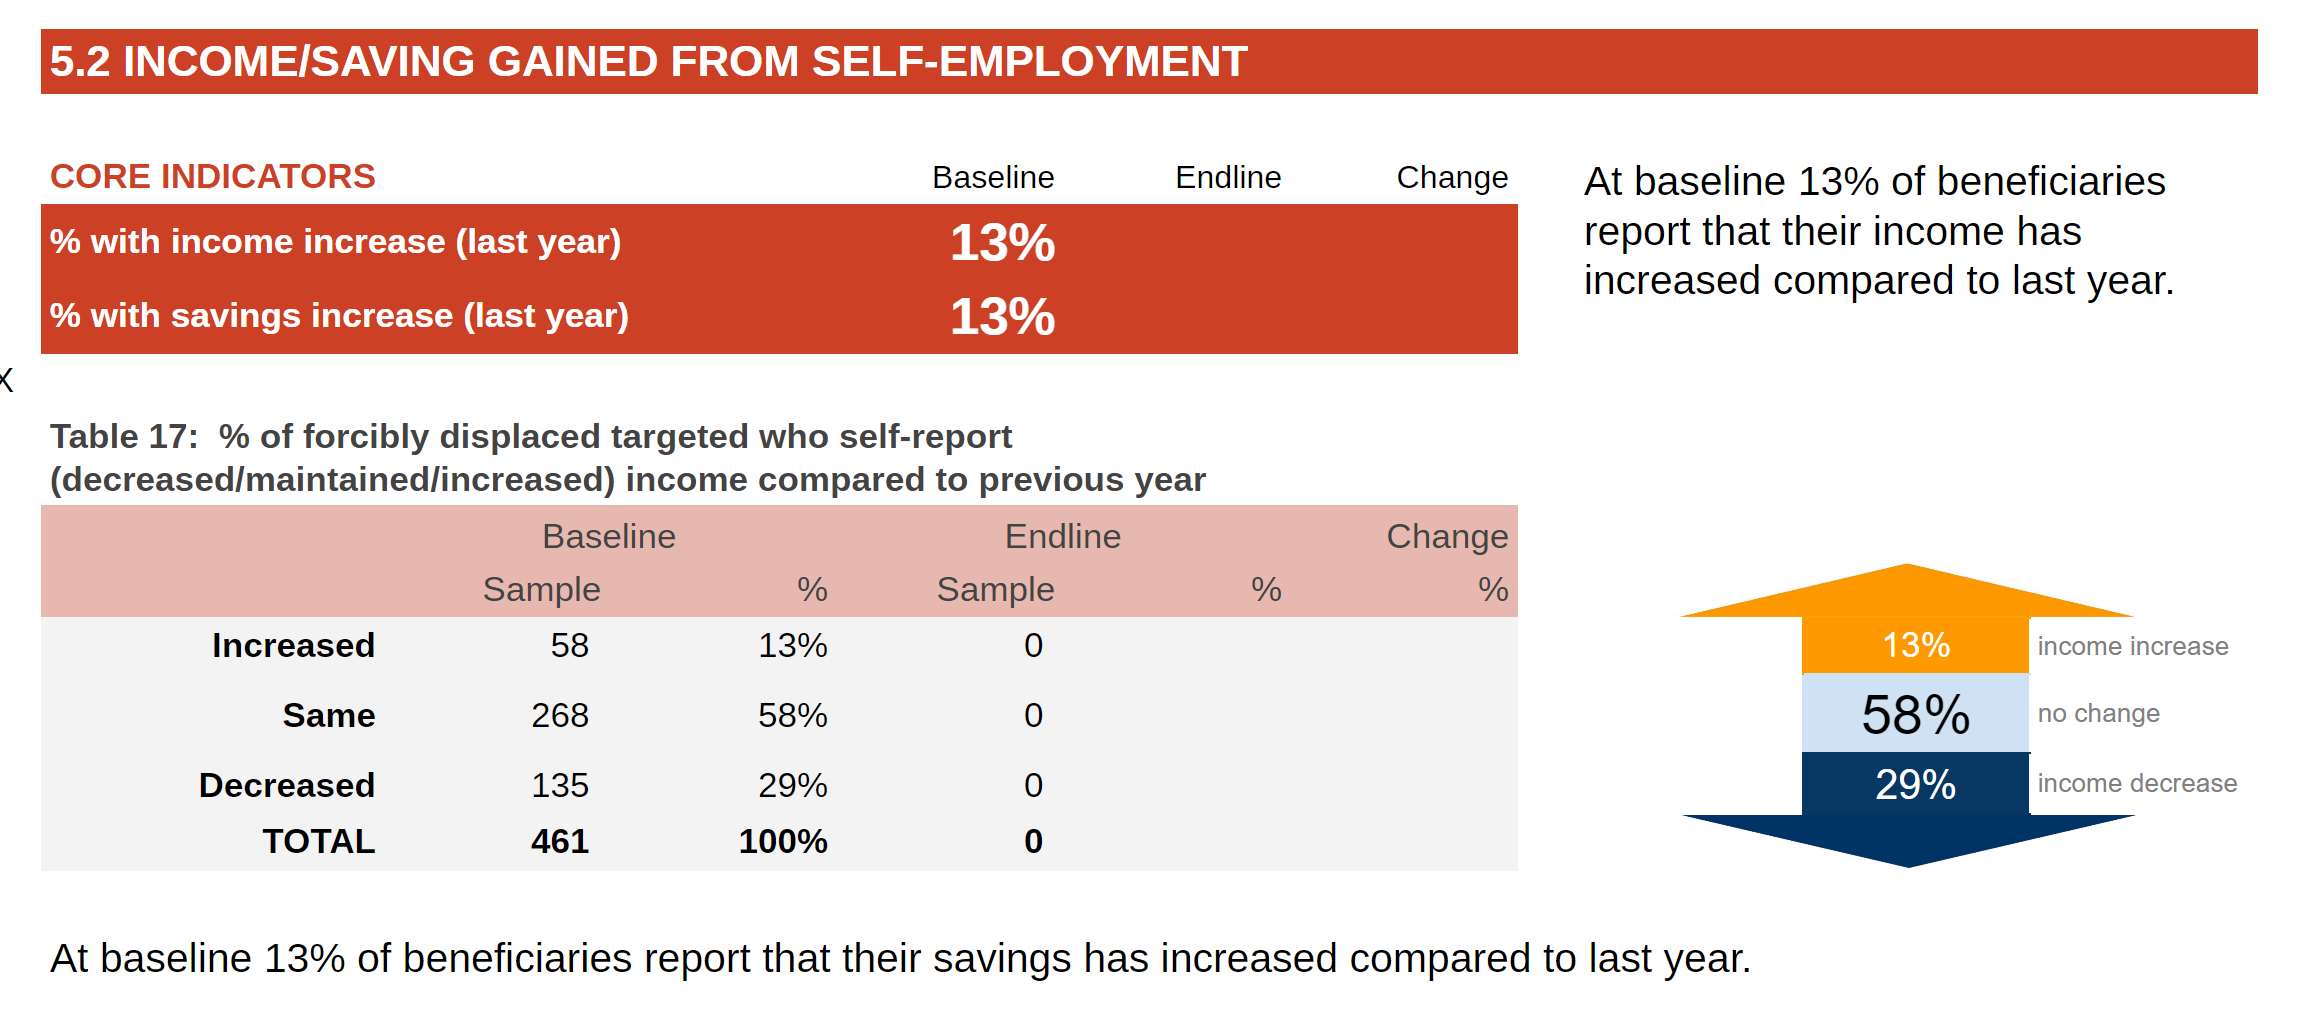
Screenshot of indicator
1 2 3 4 5 6 7 8 9 10 11 12 13 14 15 16 17 18 19 20 21 22 23 24 25 26 27 28 29 30 31 32 33 34 35 36 37 38 39 40 41 42 43 44 45 46 47 48 49 50 51 52 53 54 55 56 | function displayDataIndicator5Output2() {
/*Count baseline for Output */
totaloutputbl = countTotalNumCategoryIndicator2Agr(jsonData, "PARTNER_INFO/Output", ["O2"], "Baseline", "1");
/*Count endline for Output */
totaloutputel = countTotalNumCategoryIndicator2Agr(jsonData, "PARTNER_INFO/Output2", ["O2"], "Endline", "1");
totaloutput = totaloutputbl + totaloutputel;
if (IndicatorYN('O2') == 1 && totaloutput > 0) {
titlecolor = "#cc4125";
graphcolor = "#e6b8af";
/*5. OUTPUT 2: ACCESS TO SELF-EMPLOYMENT FACILITATED*/
/*reading of the table*/
{
totaloutputbl = countTotalNumCategoryIndicator2Agr(jsonData, "PARTNER_INFO/Output", ["O2"], "Baseline", "1");
totaloutputel = countTotalNumCategoryIndicator2Agr(jsonData, "PARTNER_INFO/Output2", ["O2"], "Endline", "1");
totaloutput = totaloutputbl + totaloutputel;
/*Table: Interventions provided to sample beneficiaries by type*/
var table44 = generateTablePercentIndicatorImpact([['O2_HA'], ['O2_SA'], ['O2_FPA_ASSETS', 'O2_FPA_CASH'], ['O2_MPPA'], ['O2_FA'], ['O2_MAPD'], ['O2_EMP']], ['Human Assets', 'Social Assets', 'Productive Assets', 'Protection of Productive Assets', 'Financial Access', 'Market Access', 'Employment Support'], jsonData, ["G_OUTPUT2/O2_Intervention"]);
/*Table: % of forcibly displaced targeted who are self-employed*/
var table411 = generateTablePercentIndicatorImpactChange([['Yes'], ['Yes_LastYear'], ['No']], ['Yes', 'Yes Last Year', 'No'], jsonData, ["G_OUTPUT2/O2_Self_Employment/O2_Employment"], "No");
/*Table : % of forcibly displaced targeted who are self-employed in the formal/informal sector*/
var table412 = generateTablePercentIndicatorImpactChange([['Yes'], ['No_In_Process', 'No_Other_Certificate', 'No']], ['Formal', 'Informal'], jsonData, ["G_OUTPUT2/O2_Self_Employment/O2_Employment_Registered"], "No", "G_OUTPUT2/O2_Self_Employment/O2_Employment", 'Yes');
/*Table : Number of others employed by self-employed beneficiaries*/
var table413 = TablecountNumItemsIndicator42Agr(['Family members', 'Friends', 'Other refugees', 'Host community'], jsonData, ['G_OUTPUT2/O2_Self_Employment/O2_Employment_Others_No/O2_Employment_Others_No_Family',
'G_OUTPUT2/O2_Self_Employment/O2_Employment_Others_No/O2_Employment_Others_No_Friends',
'G_OUTPUT2/O2_Self_Employment/O2_Employment_Others_No/O2_Employment_Others_No_Refugees',
'G_OUTPUT2/O2_Self_Employment/O2_Employment_Others_No/O2_Employment_Others_No_Host'], "G_OUTPUT2/O2_Self_Employment/O2_Employment", 'Yes');
/*Table: % of forcibly displaced targeted with own business / self-employed for (6/12) months or more*/
var table414 = generateTablePercentIndicatorImpactChange([['1', '2', '3', '4', '5'], ['6', '7', '8', '9', '10', '11'], ['12']], ['Less than 6 months', '6-12 months', 'Over 12 months'], jsonData, ["G_OUTPUT2/O2_Self_Employment/O2_Employment_Duration"], "No", "G_OUTPUT2/O2_Self_Employment/O2_Employment", 'Yes', "G_OUTPUT2/O2_Self_Employment/O2_Employment", 'Yes');
var table415 = generateTablePercentIndicatorImpactChange([['Family', 'Friends', 'Other_Refugees', 'Host_Community'], ['No']], ['Yes', 'No'], jsonData, ["G_OUTPUT2/O2_Self_Employment/O2_Employment_Others"], "No", "G_OUTPUT2/O2_Self_Employment/O2_Employment", 'Yes');
/*Table: % of forcibly displaced targeted who self-report (decreased/maintained/increased) income compared to previous year*/
var table421 = generateTablePercentIndicatorImpactChange([['Increased'], ['Same'], ['Decreased']], ['Increased', 'Same', 'Decreased'], jsonData, ['G_OUTPUT2/O2_IncomeSaving/O2_Income'], "No");
/*Table : % of forcibly displaced targeted who self-report (decreased/maintained/increased) savings compared to previous year*/
var table422 = generateTablePercentIndicatorImpactChange([['Increased'], ['Same'], ['Decreased']], ['Increased', 'Same', 'Decreased'], jsonData, ['G_OUTPUT2/O2_IncomeSaving/O2_Saving'], "No");
employothers = table415[2][2];
totalemployed = table413[6][1];
formalemployed = table412[2][2];
formalemployed2 = table412[2][3];
employed612 = table414[3][2];
employed12 = table414[4][2];
selfemployed = table411[2][2];
selfemployed2 = table411[2][3];
}
/*OUTPUT2*/
{
formatText(y2, 11, "", "Arimo", 11, "black", "white", 1, "white", "right", "0");
y2++;
formatText(y2, 2, "5. OUTPUT 2: ACCESS TO SELF-EMPLOYMENT FACILITATED", "Arimo", 18, "white", titlecolor, 8, titlecolor, "left", "bold");
formatText(y2, 10, "", "Arimo", 24, "white", titlecolor, 2, titlecolor, "right", "bold");
sumsheet.setRowHeight(y2, 50);
y2++;
y2++;
}
|
OUTPUT 2: ACCESS TO SELF-EMPLOYMENT FACILITATED >Intervention
1 2 3 4 5 6 7 8 9 10 11 12 13 14 15 16 | {
formatText(y2, 2, "Total number of forcibly displaced targeted", "Arimo", 15, "black", graphcolor, 3, graphcolor, "left", "0");
formatText(y2, 5, tpocbene2, "Arimo", 18, "black", graphcolor, 1, graphcolor, "right", "bold");
sumsheet.getRange(y2, 5).setNumberFormat('#,##0;[Red](#,##0)');
formatText(y2, 7, "Total number of host beneficiaries targeted", "Arimo", 15, "black", graphcolor, 4, graphcolor, "left", "0");
formatText(y2, 11, thbene2, "Arimo", 18, "black", graphcolor, 1, graphcolor, "right", "bold");
sumsheet.getRange(y2, 11).setNumberFormat('#,##0;[Red](#,##0)');
y2++;
y2++;
if (totaloutputel > 0) { var msgend = " and " + totaloutputel + " at endline" } else { var msgend = ""; }
var msgtemp = "Of the total " + String(tpocbene2).replace(/(\d)(?=(\d{3})+(?!\d))/g, '$1,') + " forcibly displaced and " + String(thbene2).replace(/(\d)(?=(\d{3})+(?!\d))/g, '$1,') + " host beneficiaries targeted for self-employment programes (not including those captured in Output 1 self-employed in agriculture) " + totaloutputbl + " beneficiaries have been surveyed at baseline" + msgend + "."
formatText(y2, 2, msgtemp, "Arimo", 14, "black", "white", 10, "white", "left", "0");
y2++;
y2++;
|
OUTPUT 2: ACCESS TO SELF-EMPLOYMENT FACILITATED > Table Interventions provided to sample beneficiaries by type

Screenshot of indicator
1 2 3 4 5 6 7 8 9 10 11 | {
formatText(y2, 2, "Total number of forcibly displaced targeted", "Arimo", 15, "black", graphcolor, 3, graphcolor, "left", "0");
formatText(y2, 5, tpocbene2, "Arimo", 18, "black", graphcolor, 1, graphcolor, "right", "bold");
sumsheet.getRange(y2, 5).setNumberFormat('#,##0;[Red](#,##0)');
formatText(y2, 7, "Total number of host beneficiaries targeted", "Arimo", 15, "black", graphcolor, 4, graphcolor, "left", "0");
formatText(y2, 11, thbene2, "Arimo", 18, "black", graphcolor, 1, graphcolor, "right", "bold");
sumsheet.getRange(y2, 11).setNumberFormat('#,##0;[Red](#,##0)');
y2++;
y2++;
|
5. OUTPUT 2: ACCESS TO SELF-EMPLOYMENT FACILITATED > **1) Average cost of productive assets (to start/improve a business) received per beneficiary per year; 2) Average value of cash grants (to start/improve a business) received per beneficiary per year*

Screenshot of indicator
1 2 3 4 5 6 7 8 9 10 11 12 13 14 15 16 17 18 19 20 21 22 23 24 25 26 27 28 29 30 31 32 33 34 35 36 37 38 39 40 41 42 43 44 45 46 47 | y2++;
y2++;
/********************************************/
/*displays narrative*/
displayNarrativeIndicator56Interventions(y2, 9, table44.length, tn + 1);
tn++;
/*displays the table*/
formatTables(y2, 3, table44, 'Table ' + tn + ': Interventions provided to sample beneficiaries by type',1);
/*generates label*/
displayLabelIndicator4Ouput1(y2, x2);
y2++;
formatText(y2 - 1, 2, "Note: The types of interventions are based on DFID's Sustainable Livelihoods Framework. Human Assets include all types of training; Social Assets include promotion of groups, associations, cooperatives, etc.; Productive or Financial Assets include cash grants, equipment, production materials; and Market Access includes marketing and transportation support. Product Differentiation includes packaging, labelling, certification, organic farming, etc. and Employment Support includes case management/individual coaching or labor market matching programs.", "Arimo", 10, "grey", "white", 10, "white", "left", "0");
y2++;
}
/*Partner survey data*/
{
if (jsonPartner.length > 0) {
var cx = 0;
var cx2 = 0;
/*Average value of productive assets*/
var nominator = 0;
var denominator = 0;
nominator = nominator + countNumItemsPartnerData(jsonPartner, "G_OUTPUT2/O2_FPA_001/O2_FPA_Cost");
denominator = denominator + countNumItemsPartnerData(jsonPartner, "G_OUTPUT2/O2_FPA_001/O2_FPA_Actual");
denominator = denominator + countNumItemsPartnerData(jsonPartner, "G_OUTPUT2/O2_FPA_001/O2_FPA_Actual_Host");
if (denominator > 0) {
formatText(y2, 2, "Average cost of productive assets (to start/improve a business) received per beneficiary per year", "Arimo", 15, "black", graphcolor, 8, graphcolor, "left", "0");
formatText(y2, 10, String(Math.round(((nominator * pexr) / denominator) * 100) / 100).replace(/(\d)(?=(\d{3})+(?!\d))/g, '$1,') + " USD", "Arimo", 18, "black", graphcolor, 2, graphcolor, "right", "bold");
y2++;
y2++;
cx++;
}
/*Average value of productive assets*/
nominator = 0;
denominator = 0;
nominator = nominator + countNumItemsPartnerData(jsonPartner, "G_OUTPUT2/O2_FPA_001/O2_FPA_Cash_Cost");
denominator = denominator + countNumItemsPartnerData(jsonPartner, "G_OUTPUT2/O2_FPA_001/O2_FPA_Cash_Actual");
denominator = denominator + countNumItemsPartnerData(jsonPartner, "G_OUTPUT2/O2_FPA_001/O2_FPA_Cash_Actual_Host");
if (denominator > 0) {
formatText(y2, 2, "Average value of cash grants (to start/improve a business) received per beneficiary per year", "Arimo", 15, "black", graphcolor, 8, graphcolor, "left", "0");
formatText(y2, 10, String(Math.round(((nominator * pexr) / denominator) * 100) / 100).replace(/(\d)(?=(\d{3})+(?!\d))/g, '$1,') + " USD", "Arimo", 18, "black", graphcolor, 2, graphcolor, "right", "bold");
|
5.1 SELF EMPLOYMENT
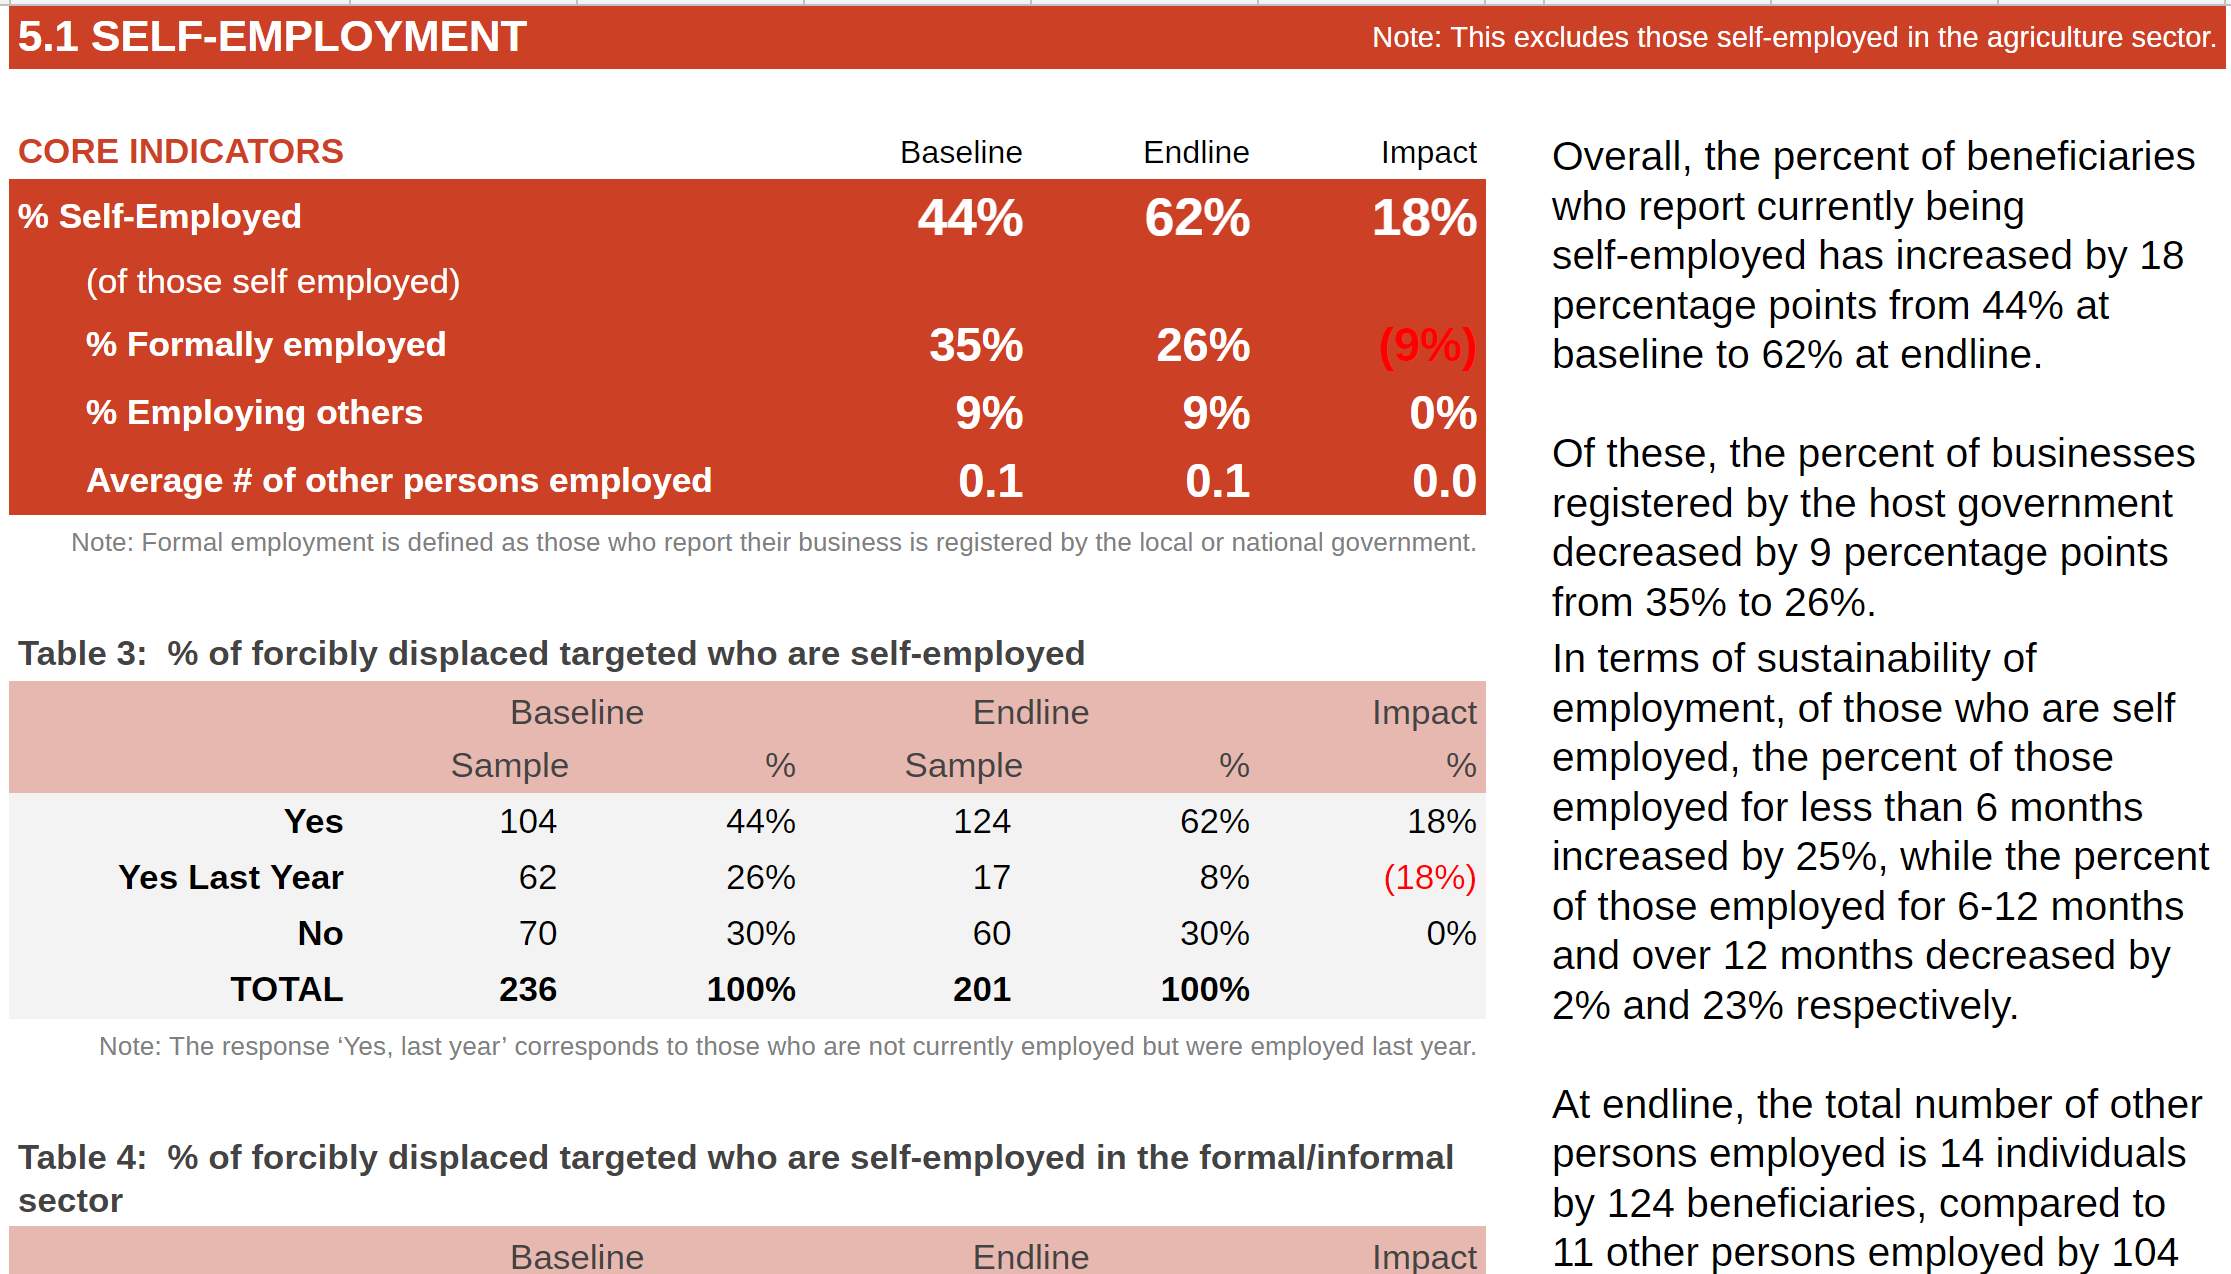
Screenshot of indicator
1 2 3 4 5 6 7 8 9 10 11 12 13 14 15 16 17 18 19 20 21 | cx2++;
}
if (cx > 0 && cx2 == 0) {
formatText(y2 - 1, 2, "Note: The information on the average amount of assistance provided has been provided at the end of the fiscal year by the implementing partner " + partnernamesp + ".", "Arimo", 10, "grey", "white", 10, "white", "left", "0");
y2++;
}
if (cx > 0 && cx2 > 0) {
formatText(y2 - 1, 2, "Note : The information on the average amount of assistance provided has been provided at the end of the fiscal year by the implementing partner " + partnernamesp + ".", "Arimo", 10, "grey", "white", 10, "white", "left", "0");
y2++;
}
}
}
/*5.1 SELF EMPLOYMENT**********************/
{
formatText(y2, 2, "5.1 SELF-EMPLOYMENT", "Arimo", 15, "white", titlecolor, 4, titlecolor, "left", "bold");
formatText(y2, 6, "Note: This excludes those self-employed in the agriculture sector.", "Arimo", 10, "white", titlecolor, 6, titlecolor, "right", "normal");
|
5.1 SELF EMPLOYMENT >Core indicators

Screenshot of indicator
1 2 3 4 5 6 7 8 9 10 11 12 13 14 15 16 17 18 19 20 21 22 23 24 25 26 27 28 29 30 31 32 33 34 35 36 37 38 39 40 41 42 43 44 45 46 47 48 49 50 51 52 | y2++;
yy = y2;
/*Table : Number of others employed by self-employed beneficiaries*/
table = table413.concat();
/*Table: % of forcibly displaced targeted with own business / self-employed for (6/12) months or more*/
table2 = table414.concat();
table3 = table415.concat();
/*Table : % of forcibly displaced targeted who are self-employed in the formal/informal sector*/
table4 = table412.concat();
/*Table %of forcibly displaced targeted who are self-employed*/
table5 = table411.concat();
/*generates narrative*/
displayNarrativeIndicator51Employment(yy - 1, 9, 25)
/*Core indicators*/
formatText(y2, 2, "% Self-Employed", "Arimo", 12, "white", titlecolor, 3, titlecolor, "left", "bold");
formatText(y2, 5, "", "Arimo", 18, "white", titlecolor, 1, titlecolor, "Right", "bold");
sumsheet.getRange(y2, 5).setValue(table411[2][2]);
formatText(y2, 6, " ", "Arimo", 18, "white", titlecolor, 1, titlecolor, "Right", "bold");
sumsheet.getRange(y2, 6).setValue(table411[2][4]);
formatText(y2, 7, " ", "Arimo", 18, "white", titlecolor, 1, titlecolor, "Right", "bold");
sumsheet.getRange(y2, 7).setValue(table411[2][5]);
y2++;
formatText(y2, 2, " (of those self employed)", "Arimo", 12, "white", titlecolor, 6, titlecolor, "left", "normal");
y2++;
formatText(y2, 2, " % Formally employed", "Arimo", 12, "white", titlecolor, 3, titlecolor, "left", "bold");
formatText(y2, 5, " ", "Arimo", 16, "white", titlecolor, 1, titlecolor, "Right", "bold");
sumsheet.getRange(y2, 5).setValue(table412[2][2]);
formatText(y2, 6, " ", "Arimo", 16, "white", titlecolor, 1, titlecolor, "Right", "bold");
sumsheet.getRange(y2, 6).setValue(table412[2][4]);
formatText(y2, 7, " ", "Arimo", 16, "white", titlecolor, 1, titlecolor, "Right", "bold");
sumsheet.getRange(y2, 7).setValue(table412[2][5]);
y2++;
formatText(y2, 2, " % Employing others", "Arimo", 12, "white", titlecolor, 3, titlecolor, "left", "bold");
formatText(y2, 5, " ", "Arimo", 16, "white", titlecolor, 1, titlecolor, "Right", "bold");
sumsheet.getRange(y2, 5).setValue(table415[2][2]);
formatText(y2, 6, " ", "Arimo", 16, "white", titlecolor, 1, titlecolor, "Right", "bold");
sumsheet.getRange(y2, 6).setValue(table415[2][4]);
formatText(y2, 7, " ", "Arimo", 16, "white", titlecolor, 1, titlecolor, "Right", "bold");
sumsheet.getRange(y2, 7).setValue(table415[2][5]);
y2++;
sumsheet.getRange(y2 - 4, 5, 4, 3).setNumberFormat('0%;[Red](0%)');
|
5.1 SELF EMPLOYMENT > Table:% of forcibly displaced targeted who are self-employed

Screenshot of table
1 2 3 4 5 | formatText(y2, 2, " Average # of other persons employed", "Arimo", 12, "white", titlecolor, 3, titlecolor, "left", "bold");
formatText(y2, 5, " ", "Arimo", 16, "white", titlecolor, 1, titlecolor, "Right", "bold");
if (totaloutputbl != 0 && table415[2][2]!="") { sumsheet.getRange(y2, 5).setValue(Math.round((table413[6][1] / table411[2][1]) * 10) / 10); }
formatText(y2, 6, " ", "Arimo", 16, "white", titlecolor, 1, titlecolor, "Right", "bold");
|
5.1 SELF EMPLOYMENT > Table:% of forcibly displaced targeted who are self-employed in the formal/informal sector

Screenshot of table
1 2 3 4 5 | if (endline != 0 && table415[2][4]!=""){
sumsheet.getRange(y2, 6).setValue(String(Math.round((table413[6][3] / table411[2][3]) * 10) / 10));
if (totaloutputbl > 0 && table415[2][2] != "") { sumsheet.getRange(y2, 7).setValue((Math.round((table413[6][3] / table411[2][3]) * 10) / 10) - (Math.round((table413[6][1] / table411[2][1]) * 10) / 10)); }
if (totaloutputbl > 0 && table415[2][2] == "") { sumsheet.getRange(y2, 7).setValue((Math.round((table413[6][3] / table411[2][3]) * 10) / 10)); }
};
|
5.1 SELF EMPLOYMENT > Table % of forcibly displaced targeted with own business / self-employed for (6/12) months or more
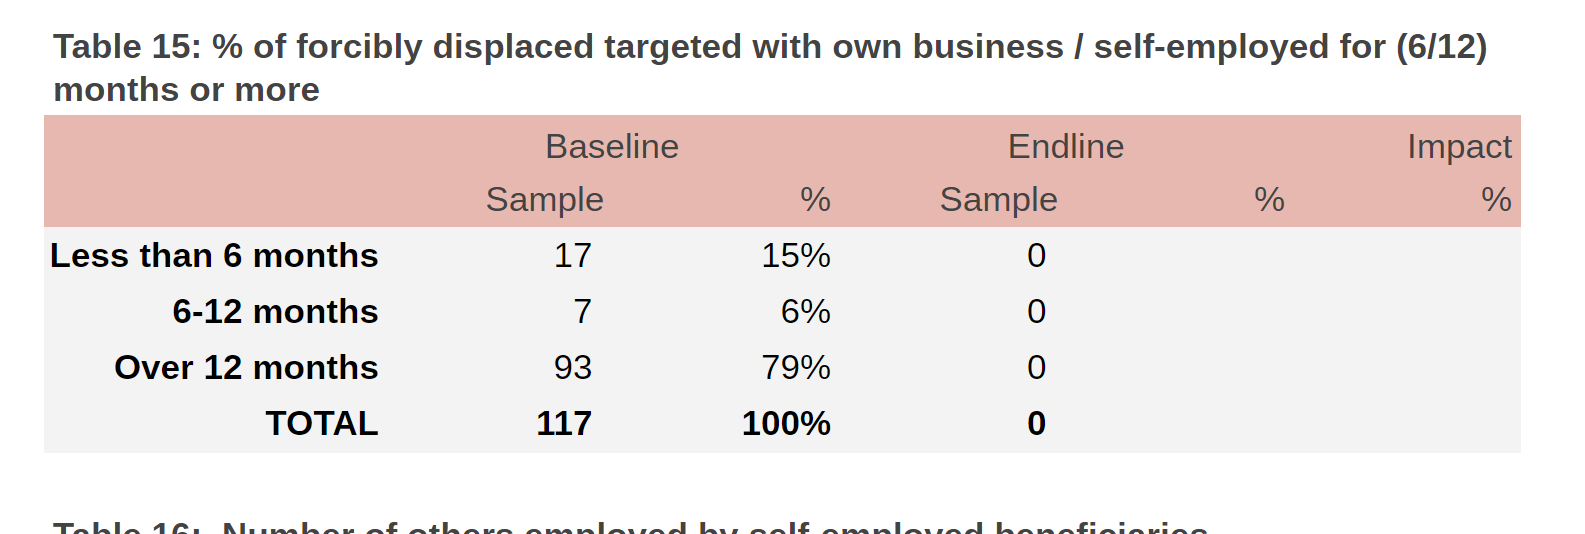
Screenshot of table
y2++;
5.1 SELF EMPLOYMENT > Table: Number of others employed by self-employed beneficiaries

Screenshot of table
1 2 3 | y2++;
y2++;
/*Core indicators end****/
|
5.2 INCOME/SAVING GAINED FROM SELF-EMPLOYMENT

Screenshot of indicator
1 2 3 4 5 6 7 8 9 10 11 12 13 14 15 16 17 18 19 20 21 22 23 24 25 26 27 28 29 30 31 32 33 34 35 36 37 38 39 40 41 42 43 44 | formatNote(y2 - 1, 7, "Note: The response ‘Yes, last year’ corresponds to those who are not currently employed but were employed last year.");
y2++;
tn++;
/*Function displays Table: % of forcibly displaced targeted who are self-employed in the formal/informal sector*/
formatTables(y2, 2, table412, 'Table ' + tn + ': % of forcibly displaced targeted who are self-employed in the formal/informal sector',2);
formatNote(y2 - 1, 7, "Note: Formal employment is defined as those who report their business is registered by the local or national government.");
y2++;
tn++;
/*Function displays Table % of forcibly displaced targeted with own business / self-employed for (6/12) months or more*/
formatTables(y2, 2, table414, 'Table ' + tn + ': % of forcibly displaced targeted with own business / self-employed for (6/12) months or more',2);
tn++;
/*Function displays the table: Number of others employed by self-employed beneficiaries*/
formatTables(y2, 2, table413, 'Table ' + tn + ': Number of others employed by self-employed beneficiaries',2);
}
/*5.2 INCOME/SAVING GAINED FROM SELF-EMPLOYMENT*/
{
y2++;
formatText(y2, 2, "5.2 INCOME/SAVING GAINED FROM SELF-EMPLOYMENT", "Arimo", 15, "white", titlecolor, 10, titlecolor, "left", "bold");
y2++;
y2++;
formatTableHeader(y2);
sumsheet.getRange(y2, 7).setValue("Change");
y2++;
yy = y2;
/*Core indicators*/
formatText(y2, 2, "% with income increase (last year)", "Arimo", 12, "white", titlecolor, 3, titlecolor, "left", "bold");
if (totaloutputel > 0) {
incomeyear = table421[2][4];
incomeyeard = table421[4][4];
savingyear = table422[2][4];
savingyeard = table422[4][4];
} else {
incomeyear = table421[2][2];
incomeyeard = table421[4][2];
savingyear = table422[2][2];
savingyeard = table422[4][2];
}
formatText(y2, 5, " ", "Arimo", 18, "white", titlecolor, 1, titlecolor, "Right", "bold");
|
5.2 INCOME/SAVING GAINED FROM SELF-EMPLOYMENT >**Table: % of forcibly displaced targested who self-report (decreased/maintained/increased) income compared to previous year**

Screenshot of table
1 2 3 4 | formatText(y2, 6, " ", "Arimo", 18, "white", titlecolor, 1, titlecolor, "Right", "bold");
sumsheet.getRange(y2, 6).setValue(table421[2][4]);
formatText(y2, 7, " ", "Arimo", 18, "white", titlecolor, 1, titlecolor, "Right", "bold");
sumsheet.getRange(y2, 7).setValue(table421[2][5]);
|
5.2 INCOME/SAVING GAINED FROM SELF-EMPLOYMENT >**Table: % of forcibly displaced targeted who self-report (decreased/maintained/increased) savings compared to previous year**
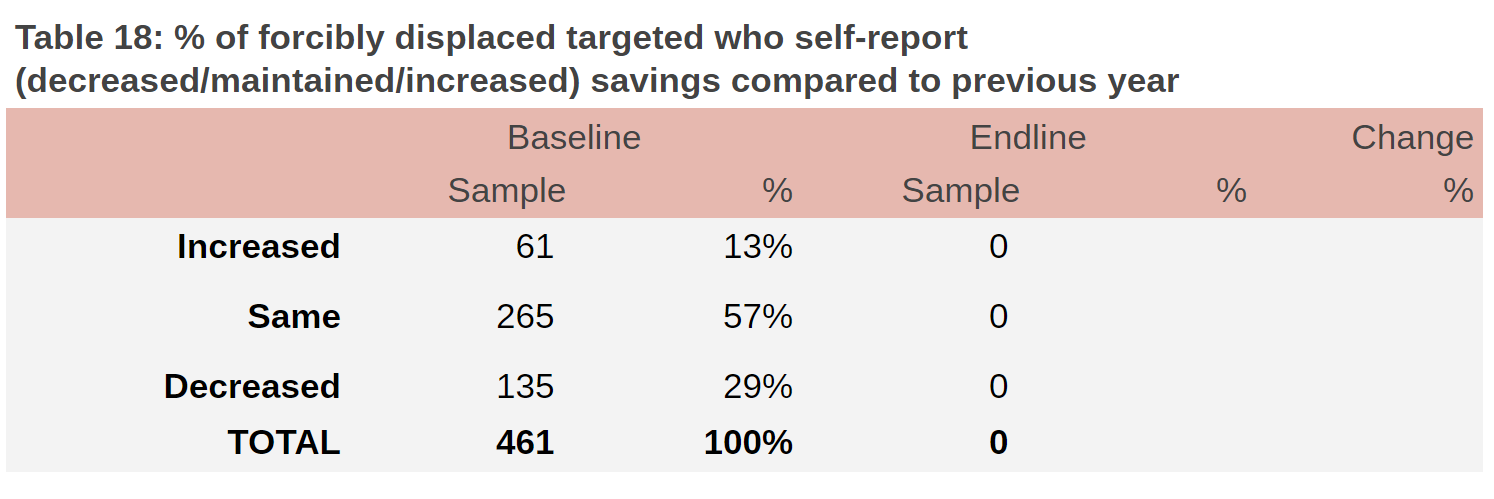
Screenshot of table
1 2 3 4 5 6 7 8 9 10 11 12 13 14 15 16 17 18 19 20 21 | formatText(y2, 2, "% with savings increase (last year)", "Arimo", 12, "white", titlecolor, 3, titlecolor, "left", "bold");
formatText(y2, 5, " ", "Arimo", 18, "white", titlecolor, 1, titlecolor, "Right", "bold");
sumsheet.getRange(y2, 5).setValue(table422[2][2]);
formatText(y2, 6, " ", "Arimo", 18, "white", titlecolor, 1, titlecolor, "Right", "bold");
sumsheet.getRange(y2, 6).setValue(table422[2][4]);
formatText(y2, 7, " ", "Arimo", 18, "white", titlecolor, 1, titlecolor, "Right", "bold");
sumsheet.getRange(y2, 7).setValue(table422[2][5]);
y2++;
sumsheet.getRange(y2 - 2, 5, 2, 3).setNumberFormat('0%;[Red](0%)');
y2++;
/*Core indicators End*/
tn++;
/*Displays the table: % of forcibly displaced targeted who self-report (decreased/maintained/increased) income compared to previous year*/
formatTables(y2, 2, table421, 'Table ' + tn + ': % of forcibly displaced targeted who self-report (decreased/maintained/increased) income compared to previous year',2);
/*arroq chart*/
formatGraphArrow(y2 - 7, 9, incomeyear, 1 - incomeyear - incomeyeard, incomeyeard, "income");
var yy2 = y2;
y2++;
|
Function displayDataIndicator6Output3
-
displayDataIndicator6Output3()¶ The function generates and displays data for 6. OUTPUT 3: ACCESS TO WAGE-EMPLOYMENT
OUTPUT2 > 6. OUTPUT 3: ACCESS TO WAGE-EMPLOYMENT
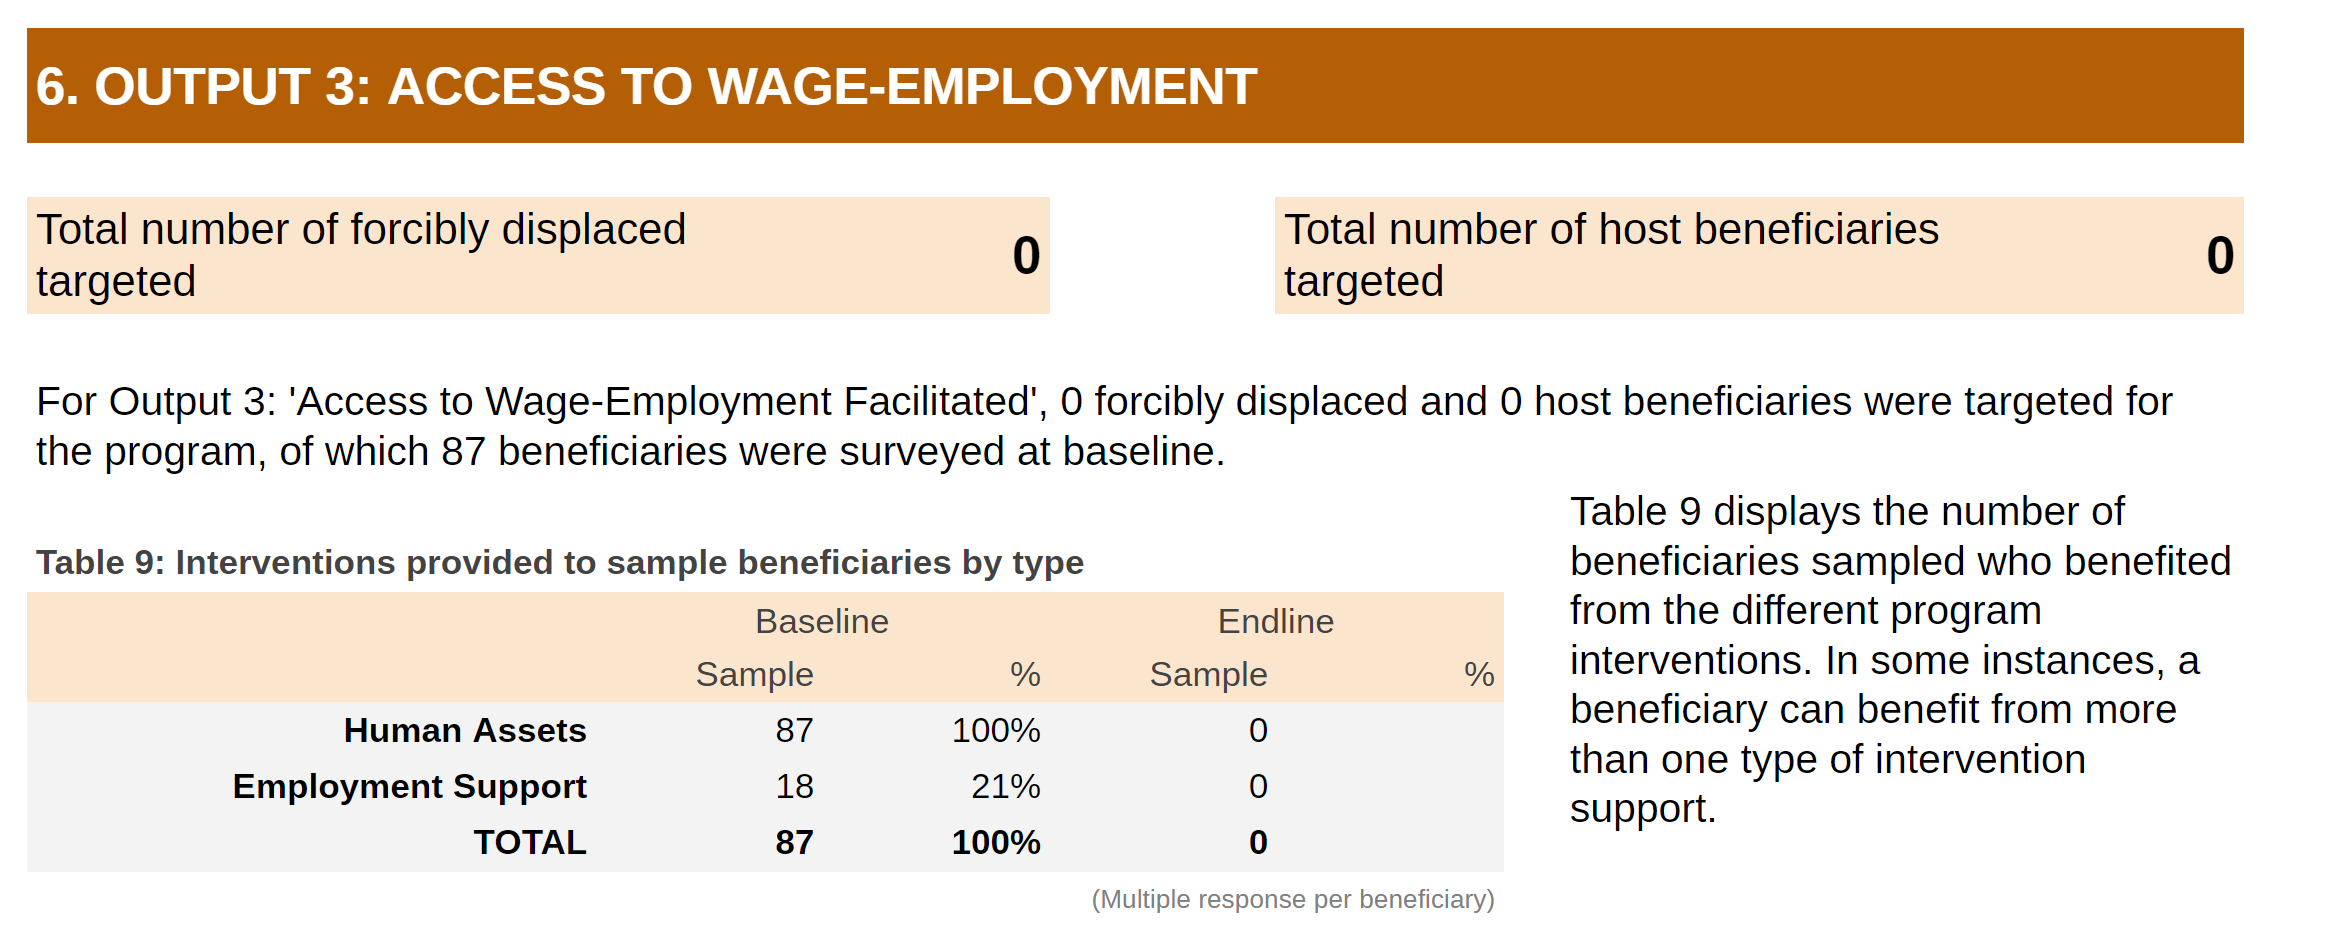
Screenshot of indicator
1 2 3 4 5 6 7 8 9 10 11 | table = table421.concat();
table2 = table422.concat();
displayNarrativeIndicator52Income(yy - 1, 9, 3);
displayNarrativeIndicator52Saving(yy2, 9, 3);
formatText(y2, 2, "Note: The % change of income and savings compared to last year could be biased if the beneficiary is a new arrival and is comparing their income or savings from last year prior to seeking asylum.", "Arimo", 9, "grey", "white", 10, "white", "left", "0");
y2++;
}
}
|
OUTPUT2 >6. OUTPUT 3: ACCESS TO WAGE-EMPLOYMENT > Tables
1 2 3 4 5 6 7 8 9 10 11 12 13 14 15 16 17 18 19 20 21 22 23 24 25 26 27 28 29 30 31 32 33 34 35 36 37 38 39 40 41 42 43 44 45 46 47 48 49 50 51 52 53 54 55 56 57 58 59 60 61 62 63 64 65 66 67 68 69 70 71 72 73 74 75 76 77 78 79 80 81 82 83 84 85 86 87 88 89 90 91 92 93 94 95 96 97 98 99 100 101 102 103 104 105 | /**
* The function generates and displays data for 6. OUTPUT 3: ACCESS TO WAGE-EMPLOYMENT
*/
function displayDataIndicator6Output3() {
totaloutputbl = countTotalNumCategoryIndicator2Agr(jsonData, "PARTNER_INFO/Output", ["O3"], "Baseline", "1");
totaloutputel = countTotalNumCategoryIndicator2Agr(jsonData, "PARTNER_INFO/Output2", ["O3"], "Endline", "1");
totaloutput = totaloutputbl + totaloutputel;
if (IndicatorYN('O3') == 1 && totaloutput > 0) {
titlecolor = "#b45f06";
graphcolor = "#fce5cd";
/*6. OUTPUT 3: ACCESS TO WAGE-EMPLOYMENT*/
{
/*Table: Interventions provided to sample beneficiaries by type*/
var table5 = generateTablePercentIndicatorImpact([['O3_HA'], ['O3_SA'], ['O3_FPA_ASSETS', 'O3_FPA_CASH'], ['O3_MPPA'], ['O3_FA'], ['O3_MAPD'], ['O3_EMP']], ['Human Assets', 'Social Assets', 'Productive Assets', 'Protection of Productive Assets', 'Financial Access', 'Market Access', 'Employment Support'], jsonData, ["G_OUTPUT3/O3_Intervention"]);
/*Table: % of forcibly displaced targeted who are wage-employed in the formal/informal sector (based on status of registration with government) */
var table511 = generateTablePercentIndicatorImpactChange([['Registered'], ['Not_Registered']], ['Formal', 'Informal'], jsonData, ["G_OUTPUT3/O3_Wage_Employment/O3_Employment_Registered"], "No", "G_OUTPUT3/O3_Wage_Employment/O3_Employment", "Yes");
/* Table : %of forcibly displaced targeted wage-employed on a monthly or permanent/daily or non-permanent basis */
var table512 = generateTablePercentIndicatorImpactChange([['Permanent'], ['Non-permanent']], ['Monthly/Permanent', 'Daily/Non permanent'], jsonData, ["G_OUTPUT3/O3_Wage_Employment/O3_Employment_Kind"], "No", "G_OUTPUT3/O3_Wage_Employment/O3_Employment", "Yes");
/* Table : % of forcibly displaced targeted wage-employed for (6/12) months or more */
var table513 = generateTablePercentIndicatorImpactChange([['1', '2', '3', '4', '5'], ['6', '7', '8', '9', '10', '11'], ['12']], ['Less than 6 months', '6-12 months', 'Over 12 months'], jsonData, ["G_OUTPUT3/O3_Wage_Employment/O3_Employment_Duration"], "No", "G_OUTPUT3/O3_Wage_Employment/O3_Employment", "Yes");
/* Table : % of forcibly displaced targeted who self-report (decreased/maintained/increased) income compared to previous year */
var table521 = generateTablePercentIndicatorImpactChange([['Increased'], ['Same'], ['Decreased']], ['Increased', 'Same', 'Decreased'], jsonData, ['G_OUTPUT3/O3_IncomeSaving/O3_Income'], "No");
/*Table : % of forcibly displaced targeted who self-report (decreased/maintained/increased) savings compared to previous year */
var table522 = generateTablePercentIndicatorImpactChange([['Increased'], ['Same'], ['Decreased']], ['Increased', 'Same', 'Decreased'], jsonData, ['G_OUTPUT3/O3_IncomeSaving/O3_Saving'], "No");
/*Table: % of forcibly displaced targeted who are wage-employed */
var table510 = generateTablePercentIndicatorImpactChange([['Yes'], ['Yes_LastYear'], ['No']], ['Yes', 'Yes Last Year', 'No'], jsonData, ["G_OUTPUT3/O3_Wage_Employment/O3_Employment"], "No");
}
{
formatText(y2, 11, "", "Arimo", 11, "black", "white", 1, "white", "right", "0");
y2++;
formatText(y2, 2, "6. OUTPUT 3: ACCESS TO WAGE-EMPLOYMENT", "Arimo", 18, "white", titlecolor, 8, titlecolor, "left", "bold");
formatText(y2, 10, "", "Arimo", 24, "white", titlecolor, 2, titlecolor, "right", "bold");
sumsheet.setRowHeight(y2, 50);
y2++;
y2++;
formatText(y2, 2, "Total number of forcibly displaced targeted", "Arimo", 15, "black", graphcolor, 3, graphcolor, "left", "0");
formatText(y2, 5, tpocbene3, "Arimo", 18, "black", graphcolor, 1, graphcolor, "right", "bold");
sumsheet.getRange(y2, 5).setNumberFormat('#,##0;[Red](#,##0)');
formatText(y2, 7, "Total number of host beneficiaries targeted", "Arimo", 15, "black", graphcolor, 4, graphcolor, "left", "0");
formatText(y2, 11, thbene3, "Arimo", 18, "black", graphcolor, 1, graphcolor, "right", "bold");
sumsheet.getRange(y2, 11).setNumberFormat('#,##0;[Red](#,##0)');
y2++;
y2++;
if (totaloutputel > 0) { var msgend = " and " + totaloutputel + " at endline" } else { var msgend = ""; }
var msgtemp = "For Output 3: 'Access to Wage-Employment Facilitated', " + String(tpocbene3).replace(/(\d)(?=(\d{3})+(?!\d))/g, '$1,') + " forcibly displaced and " + String(thbene3).replace(/(\d)(?=(\d{3})+(?!\d))/g, '$1,') + " host beneficiaries were targeted for the program, of which " + totaloutputbl + " beneficiaries were surveyed at baseline" + msgend + "."
formatText(y2, 2, msgtemp, "Arimo", 14, "black", "white", 10, "white", "left", "0");
y2++;
y2++;
}
/*Interventions*/
{
displayNarrativeIndicator56Interventions(y2 - 1, 9, table5.length + 1, tn + 1);
tn++;
/*Interventions provided to sample beneficiaries by type*/
formatTables(y2, 3, table5, 'Table ' + tn + ': Interventions provided to sample beneficiaries by type',1);
displayLabelIndicator4Ouput1(y2, x2);
y2++;
formatText(y2 - 1, 2, "Note: The types of interventions are based on DFID's Sustainable Livelihoods Framework. Human Assets include all types of training, Social Assets include promotion of groups, associations, cooperatives, etc. Productive or Financial Assets include cash grants, and Employment Support includes case management/individual coaching or labor market matching programs.", "Arimo", 10, "grey", "white", 10, "white", "left", "0");
y2++;
}
/*partner survey data*/
{
if (jsonPartner.length > 0) {
var cx = 0;
var cx2 = 0;
/*Average value of productive assets*/
var nominator = 0;
var denominator = 0;
nominator = nominator + countNumItemsPartnerData(jsonPartner, "G_OUTPUT3/O3_FPA_001/O3_FPA_Cost");
denominator = denominator + countNumItemsPartnerData(jsonPartner, "G_OUTPUT3/O3_FPA_001/O3_FPA_Actual");
denominator = denominator + countNumItemsPartnerData(jsonPartner, "G_OUTPUT3/O3_FPA_001/O3_FPA_Actual_Host");
if (denominator > 0) {
formatText(y2, 2, "Average cost of productive assets (to engage in wage employment) received per beneficiary per year", "Arimo", 15, "black", graphcolor, 8, graphcolor, "left", "0");
formatText(y2, 10, String(Math.round(((nominator * pexr) / denominator) * 100) / 100).replace(/(\d)(?=(\d{3})+(?!\d))/g, '$1,') + " USD", "Arimo", 18, "black", graphcolor, 2, graphcolor, "right", "bold");
y2++;
y2++;
cx++;
}
/*Average value of productive assets*/
nominator = 0;
denominator = 0;
nominator = nominator + countNumItemsPartnerData(jsonPartner, "G_OUTPUT3/O3_FPA_001/O3_FPA_Cash_Cost");
denominator = denominator + countNumItemsPartnerData(jsonPartner, "G_OUTPUT3/O3_FPA_001/O3_FPA_Cash_Actual");
denominator = denominator + countNumItemsPartnerData(jsonPartner, "G_OUTPUT3/O3_FPA_001/O3_FPA_Actual_Host");
if (denominator > 0) {
formatText(y2, 2, "Average value of cash grants (to help find or maintain a job) received per beneficiary per year", "Arimo", 15, "black", graphcolor, 8, graphcolor, "left", "0");
formatText(y2, 10, String(Math.round(((nominator * pexr) / denominator) * 100) / 100).replace(/(\d)(?=(\d{3})+(?!\d))/g, '$1,') + " USD", "Arimo", 18, "black", graphcolor, 2, graphcolor, "right", "bold");
|
6.1 WAGE-EMPLOYMENT
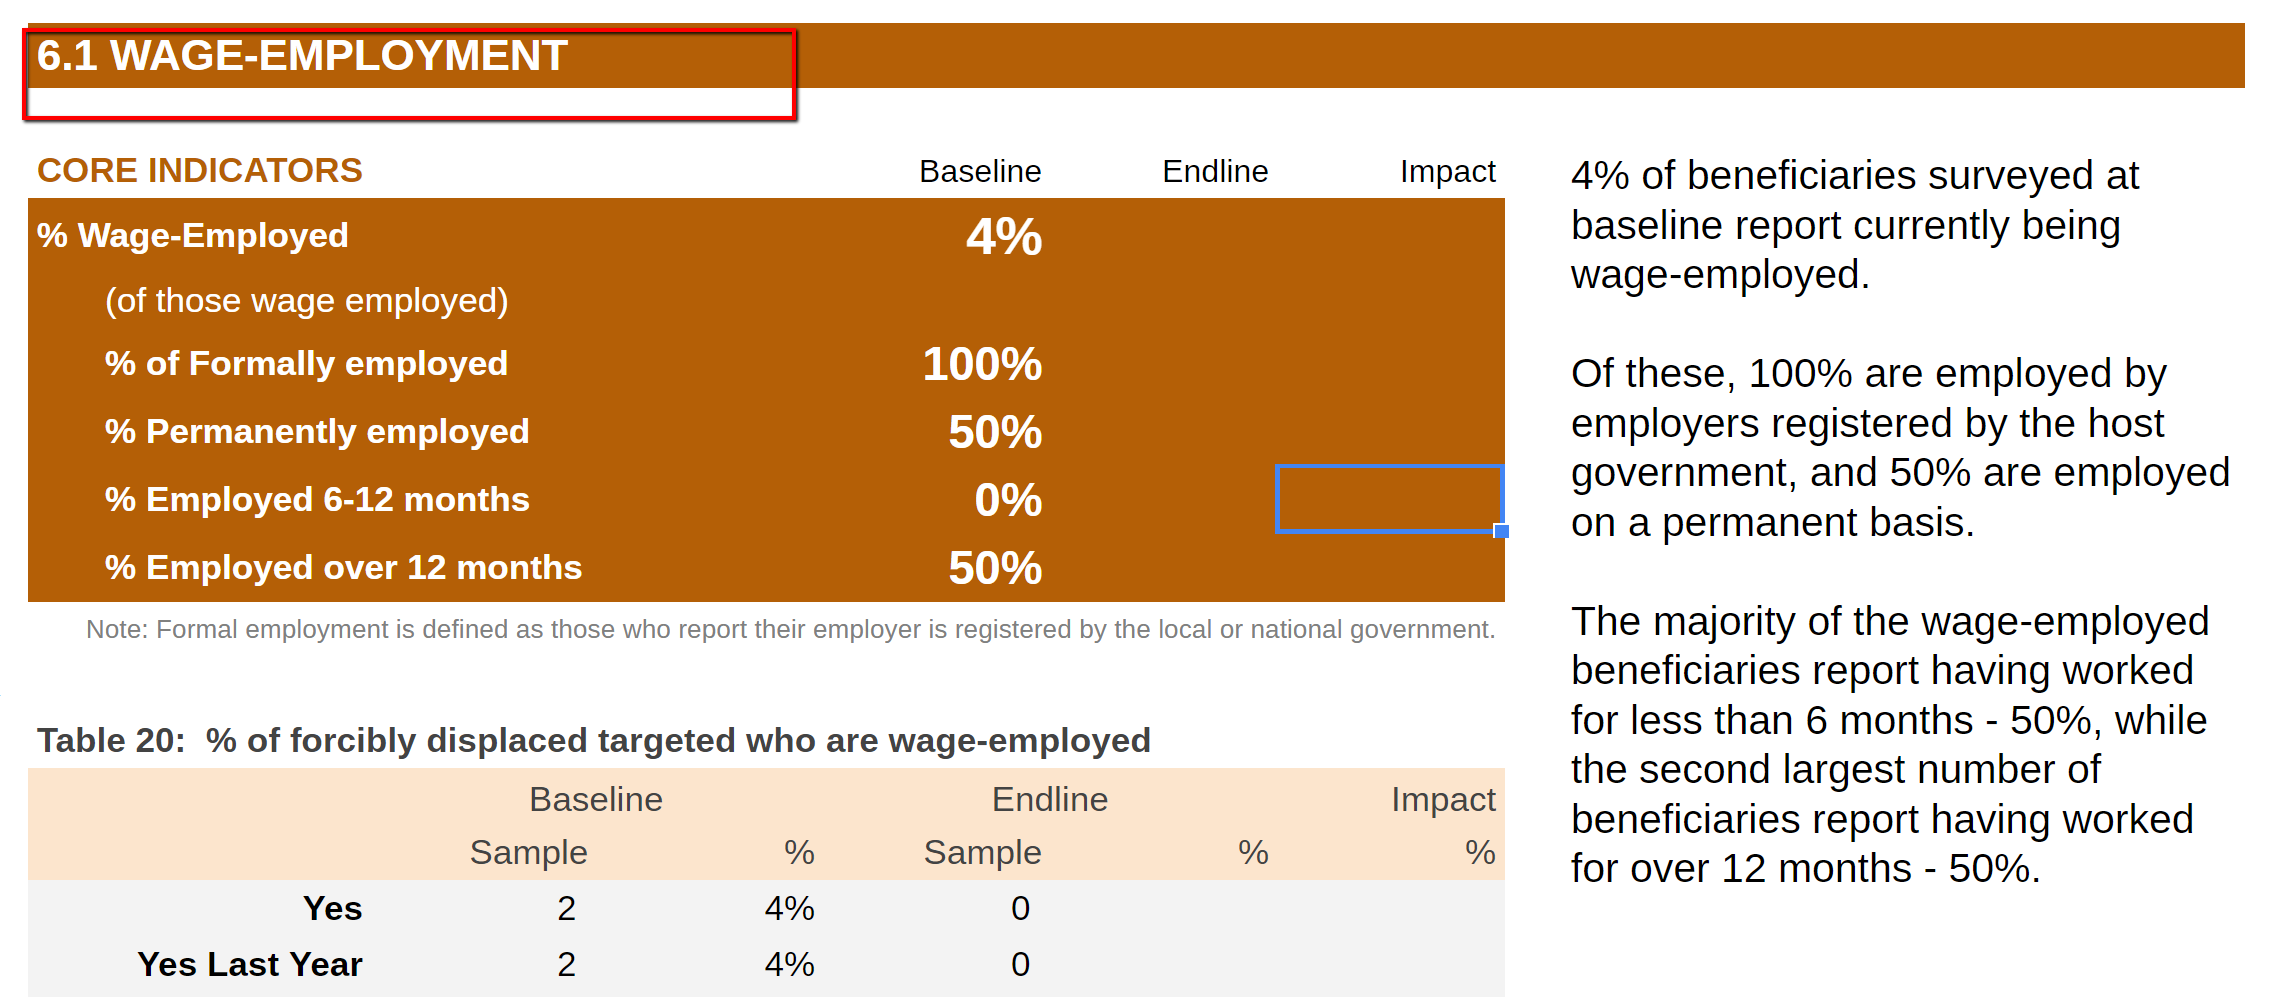
Screenshot of indicator
1 2 3 4 5 6 7 8 9 10 11 12 13 14 15 16 17 18 19 20 21 22 | cx++;
cx2++;
}
if (cx > 0 && cx2 == 0) {
formatText(y2 - 1, 2, "Note: The information on the average amount of assistance provided has been provided at the end of the fiscal year by the implementing partner " + partnernamesp + ".", "Arimo", 10, "grey", "white", 10, "white", "left", "0");
y2++;
}
if (cx > 0 && cx2 > 0) {
formatText(y2 - 1, 2, "Note : The information on the average amount of assistance provided has been provided at the end of the fiscal year by the implementing partner " + partnernamesp + ".", "Arimo", 10, "grey", "white", 10, "white", "left", "0");
y2++;
}
}
}
/*6.1 WAGE-EMPLOYMENT*/
{
formatText(y2, 2, "6.1 WAGE-EMPLOYMENT", "Arimo", 15, "white", titlecolor, 10, titlecolor, "left", "bold");
|
6.1 WAGE-EMPLOYMENT >Core Indicators
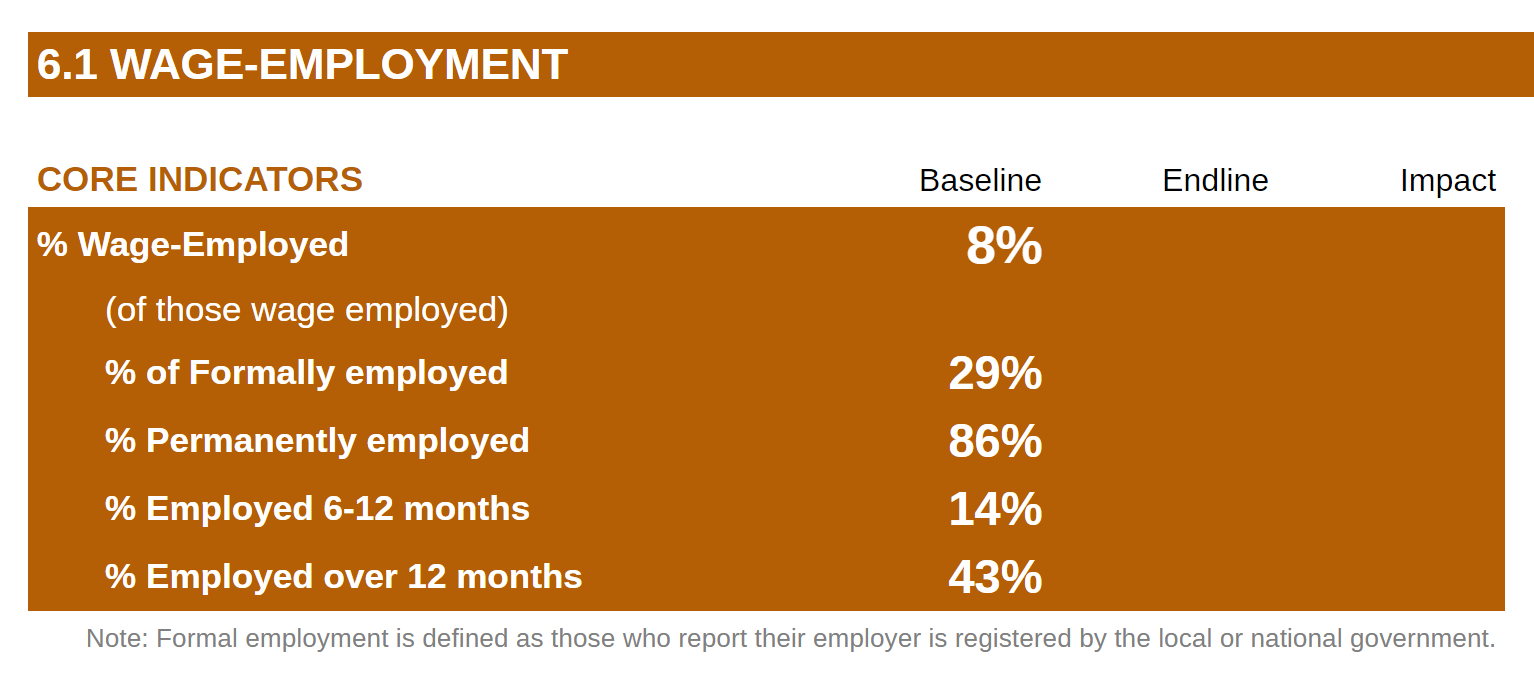
Screenshot of indicator
1 2 3 4 5 6 7 8 9 10 11 12 13 14 15 16 17 18 19 20 21 22 23 24 25 26 27 28 29 30 31 32 33 34 35 36 37 38 39 40 41 42 43 44 45 46 47 48 49 50 51 52 53 54 55 56 57 | y2++;
formatTableHeader(y2);
y2++;
yy = y2;
selfemployed = table510[2][2];
formalemployed = table511[2][2];
employed612 = table513[3][2];
employed12 = table513[4][2];
permanentemployed = table512[2][2];
table = table510.concat();//wage employment
table2 = table511.concat();//formal employment
table3 = table512.concat();//permanent
table4 = table513.concat();//duration
displayNarrativeIndicator61WageEmpl(yy - 1, 9, 15)
/*Core indicators*/
formatText(y2, 2, "% Wage-Employed", "Arimo", 12, "white", titlecolor, 3, titlecolor, "left", "bold");
formatText(y2, 5, "", "Arimo", 18, "white", titlecolor, 1, titlecolor, "Right", "bold");
sumsheet.getRange(y2, 5).setValue(table510[2][2]);
formatText(y2, 6, " ", "Arimo", 18, "white", titlecolor, 1, titlecolor, "Right", "bold");
sumsheet.getRange(y2, 6).setValue(table510[2][4]);
formatText(y2, 7, " ", "Arimo", 18, "white", titlecolor, 1, titlecolor, "Right", "bold");
sumsheet.getRange(y2, 7).setValue(table510[2][5]);
y2++;
formatText(y2, 2, " (of those wage employed)", "Arimo", 12, "white", titlecolor, 6, titlecolor, "left", "normal");
y2++;
formatText(y2, 2, " % of Formally employed", "Arimo", 12, "white", titlecolor, 3, titlecolor, "left", "bold");
formatText(y2, 5, " ", "Arimo", 16, "white", titlecolor, 1, titlecolor, "Right", "bold");
sumsheet.getRange(y2, 5).setValue(table511[2][2]);
formatText(y2, 6, " ", "Arimo", 16, "white", titlecolor, 1, titlecolor, "Right", "bold");
sumsheet.getRange(y2, 6).setValue(table511[2][4]);
formatText(y2, 7, " ", "Arimo", 16, "white", titlecolor, 1, titlecolor, "Right", "bold");
sumsheet.getRange(y2, 7).setValue(table511[2][5]);
y2++;
formatText(y2, 2, " % Permanently employed", "Arimo", 12, "white", titlecolor, 3, titlecolor, "left", "bold");
formatText(y2, 5, " ", "Arimo", 16, "white", titlecolor, 1, titlecolor, "Right", "bold");
sumsheet.getRange(y2, 5).setValue(table512[2][2]);
formatText(y2, 6, " ", "Arimo", 16, "white", titlecolor, 1, titlecolor, "Right", "bold");
sumsheet.getRange(y2, 6).setValue(table512[2][4]);
formatText(y2, 7, " ", "Arimo", 16, "white", titlecolor, 1, titlecolor, "Right", "bold");
sumsheet.getRange(y2, 7).setValue(table512[2][5]);
y2++;
formatText(y2, 2, " % Employed 6-12 months", "Arimo", 12, "white", titlecolor, 3, titlecolor, "left", "bold");
formatText(y2, 5, " ", "Arimo", 16, "white", titlecolor, 1, titlecolor, "Right", "bold");
sumsheet.getRange(y2, 5).setValue(table513[3][2]);
formatText(y2, 6, " ", "Arimo", 16, "white", titlecolor, 1, titlecolor, "Right", "bold");
|
6.1 WAGE-EMPLOYMENT > Tables
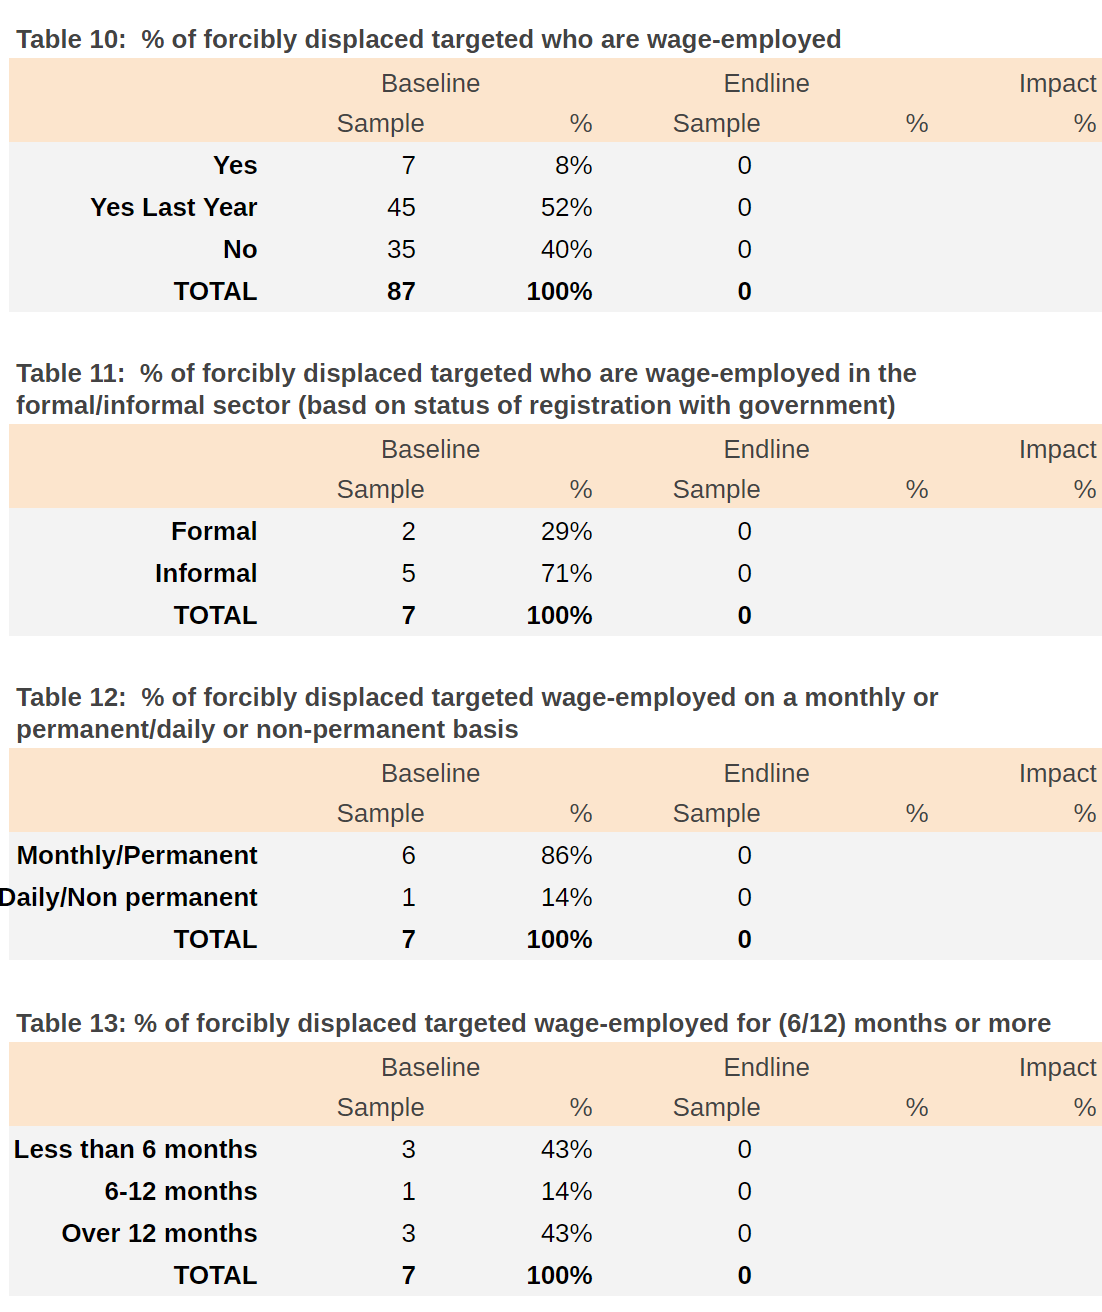
Screenshot of tables
1 2 3 4 5 6 7 8 9 10 11 12 | formatText(y2, 7, " ", "Arimo", 16, "white", titlecolor, 1, titlecolor, "Right", "bold");
sumsheet.getRange(y2, 7).setValue(table513[3][5]);
y2++;
formatText(y2, 2, " % Employed over 12 months", "Arimo", 12, "white", titlecolor, 3, titlecolor, "left", "bold");
formatText(y2, 5, " ", "Arimo", 16, "white", titlecolor, 1, titlecolor, "Right", "bold");
sumsheet.getRange(y2, 5).setValue(table513[4][2]);
formatText(y2, 6, " ", "Arimo", 16, "white", titlecolor, 1, titlecolor, "Right", "bold");
sumsheet.getRange(y2, 6).setValue(table513[4][4]);
formatText(y2, 7, " ", "Arimo", 16, "white", titlecolor, 1, titlecolor, "Right", "bold");
sumsheet.getRange(y2, 7).setValue(table513[4][5]);
|
6.2 INCOME/SAVING CHANGE GAINED FROM WAGE-EMPLOYMENT
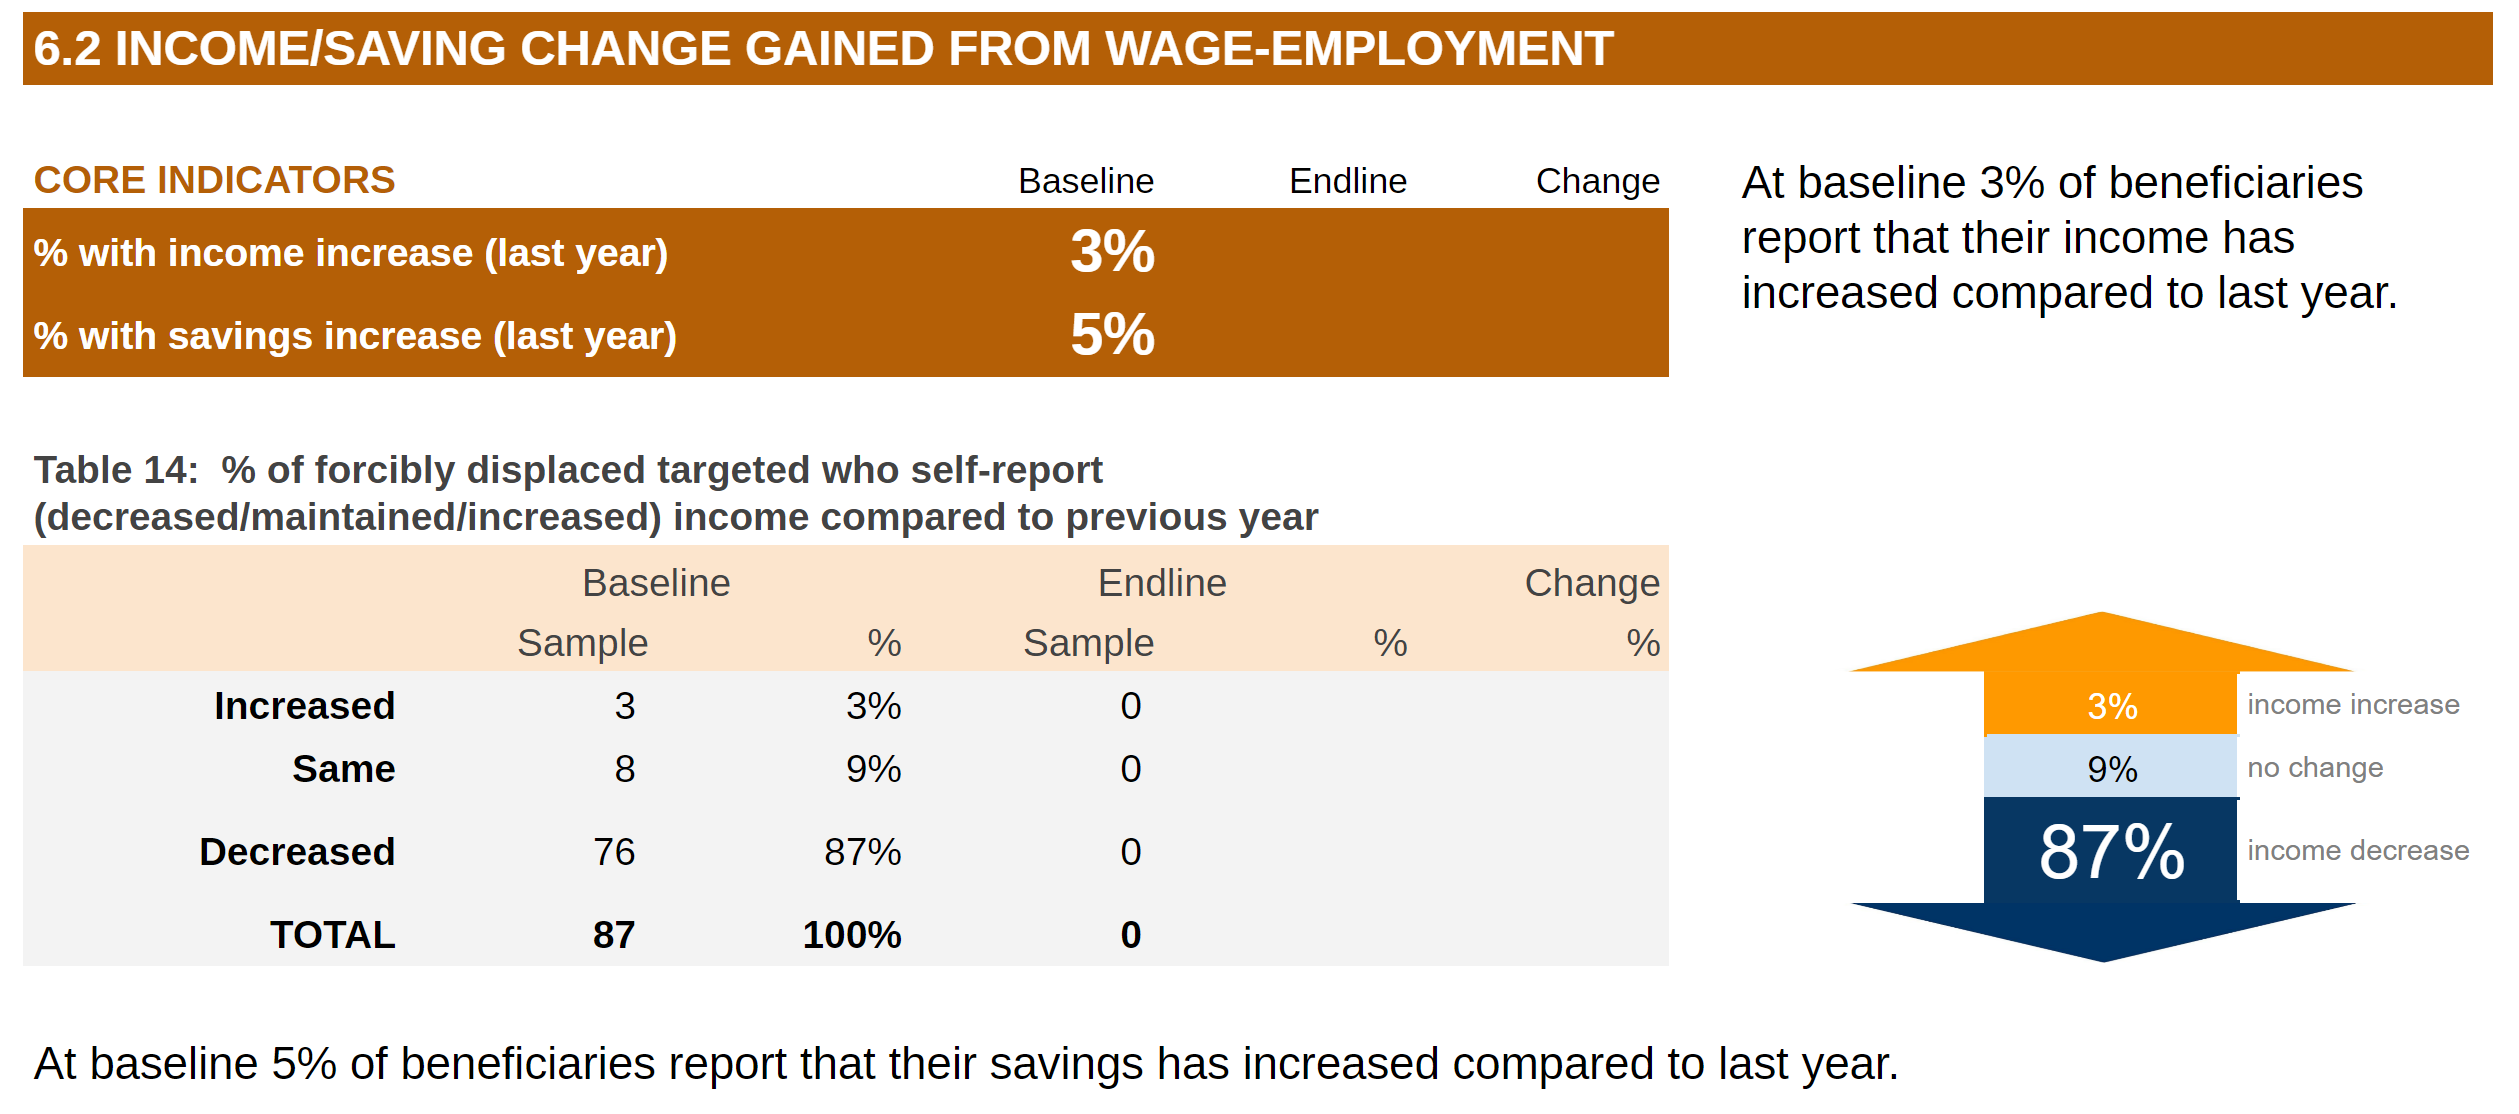
Screenshot of indicator
1 2 3 4 5 6 7 8 9 10 11 12 13 14 15 16 17 18 19 20 21 22 23 24 25 26 27 28 29 30 31 32 33 34 35 36 37 38 39 40 41 42 43 44 45 46 47 | formatNote(y2, 7, "Note: Formal employment is defined as those who report their employer is registered by the local or national government.");
y2++;
y2++;
/*End of Core Indicators*/
tn++;
/* Table : % of forcibly displaced targeted who are wage-employed */
formatTables(y2, 2, table510, 'Table ' + tn + ': % of forcibly displaced targeted who are wage-employed',2);
/*Table : % of forcibly displaced targeted who are wage-employed in the formal/informal sector (based on status of registration with government) */
tn++;
formatTables(y2, 2, table511, 'Table ' + tn + ': % of forcibly displaced targeted who are wage-employed in the formal/informal sector (based on status of registration with government)',2);
/*Table: % of forcibly displaced targeted wage-employed on a monthly or permanent/daily or non-permanent basis */
tn++;
formatTables(y2, 2, table512, 'Table ' + tn + ': % of forcibly displaced targeted wage-employed on a monthly or permanent/daily or non-permanent basis',2);
/*Table : % of forcibly displaced targeted wage-employed for (6/12) months or more */
tn++;
formatTables(y2, 2, table513, 'Table ' + tn + ': % of forcibly displaced targeted wage-employed for (6/12) months or more',2);
}
/*6.2 INCOME/SAVING CHANGE GAINED FROM WAGE-EMPLOYMENT*/
{
formatText(y2, 2, "6.2 INCOME/SAVING CHANGE GAINED FROM WAGE-EMPLOYMENT", "Arimo", 15, "white", titlecolor, 10, titlecolor, "left", "bold");
y2++;
y2++;
formatTableHeader(y2);
sumsheet.getRange(y2, 7).setValue("Change");
y2++;
yy = y2;
/*core indicators*/
formatText(y2, 2, "% with income increase (last year)", "Arimo", 12, "white", titlecolor, 3, titlecolor, "left", "bold");
if (totaloutputel > 0) {
incomeyear = table521[2][4];
incomeyeard = table521[4][4];
savingyear = table522[2][4];
savingyeard = table522[4][4];
}
else {
incomeyear = table521[2][2];
incomeyeard = table521[4][2];
savingyear = table522[2][2];
savingyeard = table522[4][2];
}
formatText(y2, 5, " ", "Arimo", 18, "white", titlecolor, 1, titlecolor, "Right", "bold");
sumsheet.getRange(y2, 5).setValue(table521[2][2]);
|
6.2 INCOME/SAVING CHANGE GAINED FROM WAGE-EMPLOYMENT > Table: % of forcibly displaced targeted who self-report (decreased/maintained/increased) income compared to previous year
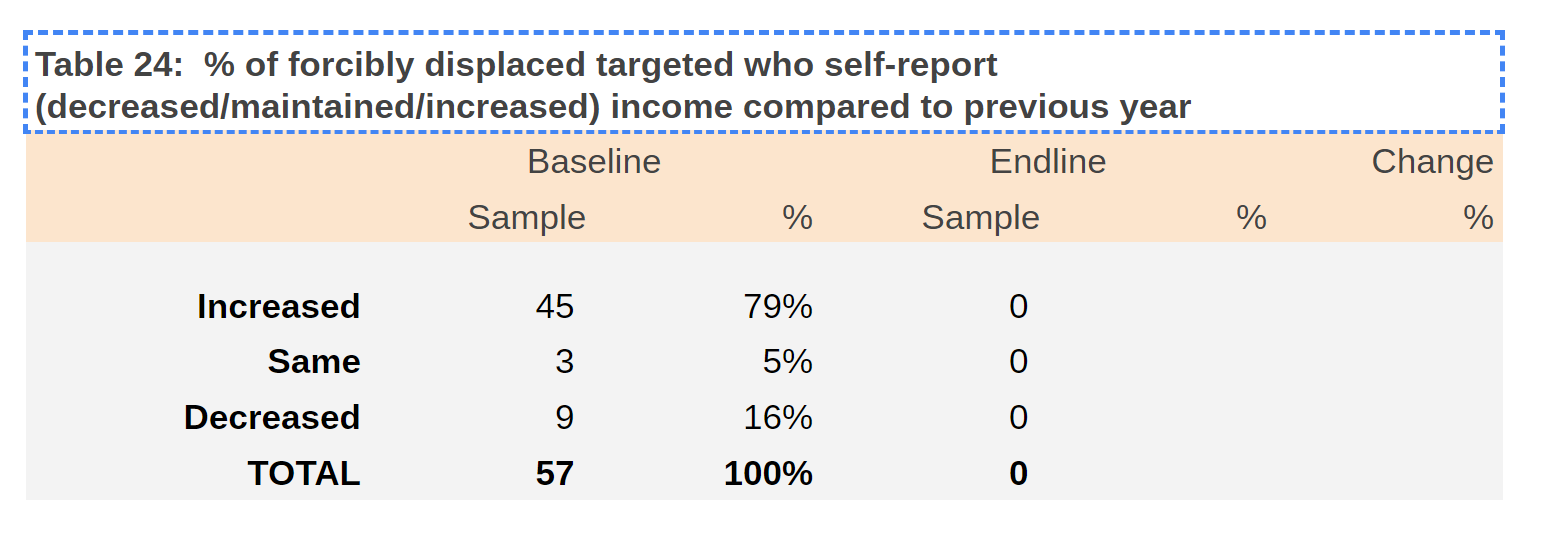
Screenshot of table
1 2 3 4 5 6 7 | formatText(y2, 6, " ", "Arimo", 18, "white", titlecolor, 1, titlecolor, "Right", "bold");
sumsheet.getRange(y2, 6).setValue(table521[2][4]);
formatText(y2, 7, " ", "Arimo", 18, "white", titlecolor, 1, titlecolor, "Right", "bold");
sumsheet.getRange(y2, 7).setValue(table521[2][5]);
y2++;
formatText(y2, 2, "% with savings increase (last year)", "Arimo", 12, "white", titlecolor, 3, titlecolor, "left", "bold");
|
6.2 INCOME/SAVING CHANGE GAINED FROM WAGE-EMPLOYMENT > Table : % of forcibly displaced targeted who self-report (decreased/maintained/increased) savings compared to previous year

Screenshot of table
1 2 3 4 5 6 7 8 9 10 11 | sumsheet.getRange(y2, 5).setValue(table522[2][2]);
formatText(y2, 6, " ", "Arimo", 18, "white", titlecolor, 1, titlecolor, "Right", "bold");
sumsheet.getRange(y2, 6).setValue(table522[2][4]);
formatText(y2, 7, " ", "Arimo", 18, "white", titlecolor, 1, titlecolor, "Right", "bold");
sumsheet.getRange(y2, 7).setValue(table522[2][5]);
y2++;
sumsheet.getRange(y2 - 2, 5, 2, 3).setNumberFormat('0%;[Red](0%)');
y2++;
tn++;
|
Function displayNarrativeIndicator4Output3
-
displayNarrativeIndicator4Output3(y, z, tn)¶ The function generates the narrative(1) for 4.3 INCOME/SAVING GAINED FROM AGRICULTURE
- Arguments
y (string) – row
z (string) – column
tn (string) – number of the table

Screenshot of narrative
1 2 3 4 | elavarageanimal = 0,
elbene = 0;
var selfemployed = 0;
//var employothers = 0;
|
Function displayNarrativeIndicator41Agriculture
-
displayNarrativeIndicator41Agriculture(y, x, tn)¶ The function generates the narrative for 4.1 AGRICULTURAL EMPLOYMENT
- Arguments
y (string) – row
x (string) – column
tn (string) – number of the table

Screenshot of narrative
1 2 3 4 5 6 7 8 9 10 11 12 13 14 15 16 17 18 19 20 21 22 23 24 25 26 27 28 29 30 31 32 33 34 35 36 37 38 39 40 41 42 43 44 45 46 47 48 49 50 51 52 53 54 55 56 57 58 59 60 61 62 63 64 65 66 67 68 69 70 71 72 73 74 75 76 77 78 79 80 81 82 83 84 85 86 87 88 89 90 91 92 | totalcropkg = 0,
totalcrophc = 0,
totalaveragelivestock = 0,
totalaveragelivestock2 = 0,
totalcropkg2 = 0,
totalcrophc2 = 0,
totalaveragelivestock2 = 0;
var firstcrop = "",
firstcropkg = 0,
firstcrophc = 0,
firstcropratio = 0,
firstcropnational = 0;
var secondcrop = "",
secondcropkg = 0,
secondcrophc = 0,
secondcropratio = 0,
secondcropnational = 0;
var firstlivestock = "",
firsttotallivestock = 0,
firstaveragelivestock = 0;
var fishtotal = 0, fishtotal2;
fishbene = 0,
fishbene2 = 0;
/**
* The function generates the narrative(1) for 4.3 INCOME/SAVING GAINED FROM AGRICULTURE
* @param {string} y - row
* @param {string} z - column
* @param {string} tn - number of the table
*/
function displayNarrativeIndicator4Output3(y, x, z, tn) {
text = "Table " + tn + " reflects the results for those who will benefit from a crop agriculture program and thus asks future beneficiaries about the change in income relative to last season. Table " + (tn + 1) + " reflects the results of those who will benefit from either a livestock or fisheries agriculture program and hence asks future beneficiaries about the change in income relative to last year."
mergeText2(y, 2, z, text, 10);
}
/**
* The function generates the narrative for 4.1 AGRICULTURAL EMPLOYMENT
* @param {string} y - row
* @param {string} x - column
* @param {string} tn - number of the table
*/
function displayNarrativeIndicator41Agriculture(y, x, z) {
if (totaloutputbl > 0 && totaloutputel > 0) {
}
else if (totaloutputel == 0 && totaloutputbl > 0) {
text = text + String.fromCharCode(10) + String.fromCharCode(10) + "The majority of beneficiaries surveyed who benefit from the agriculture programs report at baseline that they are <1> " +
"and contracted on a <2> basis." + String.fromCharCode(10) + String.fromCharCode(10) + "Of the <3> of beneficiaries who report employing others the largest number of employees are reported to be <4> at baseline.";
var self = table[2][2] + table[3][2] + table[4][2];
var wage = table[5][2] + table[6][2] + table[7][2];
if (self > wage) {
t1 = "self-employed";
} else {
t1 = "wage-employed";
}
text = text.replace("<1>", t1);
var t = table[8][1];
table[8][1] = 0;
table = sortTable(table, 1);
if (table[2][0].indexOf("Permanent") > -1) {
t1 = "permanent";
}
if (table[2][0].indexOf("Monthly") > -1) {
t1 = "monthly";
}
if (table[2][0].indexOf("Daily") > -1) {
t1 = "daily";
}
text = text.replace("<2>", t1);
table[8][1] = t;
t1 = Math.round(table3[2][2] * 100) + "%";
text = text.replace("<3>", t1);
var t = table2[6][1];
table2[6][1] = 0;
table = sortTable(table2, 1);
t1 = table[2][0].toLowerCase();
t1 = t1 + " - " + Math.round(table[2][2] * 100) + "% -";
text = text.replace("<4>", t1);
table2[6][1] = t;
}
else if (totaloutputel > 0 && totaloutputbl == 0) {
text = text + String.fromCharCode(10) + String.fromCharCode(10) + "The majority of beneficiaries surveyed who benefit from the agriculture programs report at endline that they are <1> " +
"and contracted on a <2> basis." + String.fromCharCode(10) + String.fromCharCode(10) + "Of the <3> of beneficiaries who report employing others the largest number of employees are reported to be <4> at endline.";
|
Function displayNarrativeIndicator41a
-
displayNarrativeIndicator41a(y, x, tn)¶ The function generates the narrative for 4.1 AGRICULTURAL EMPLOYMENT
- Arguments
y (string) – row
x (string) – column
tn (string) – number of the table
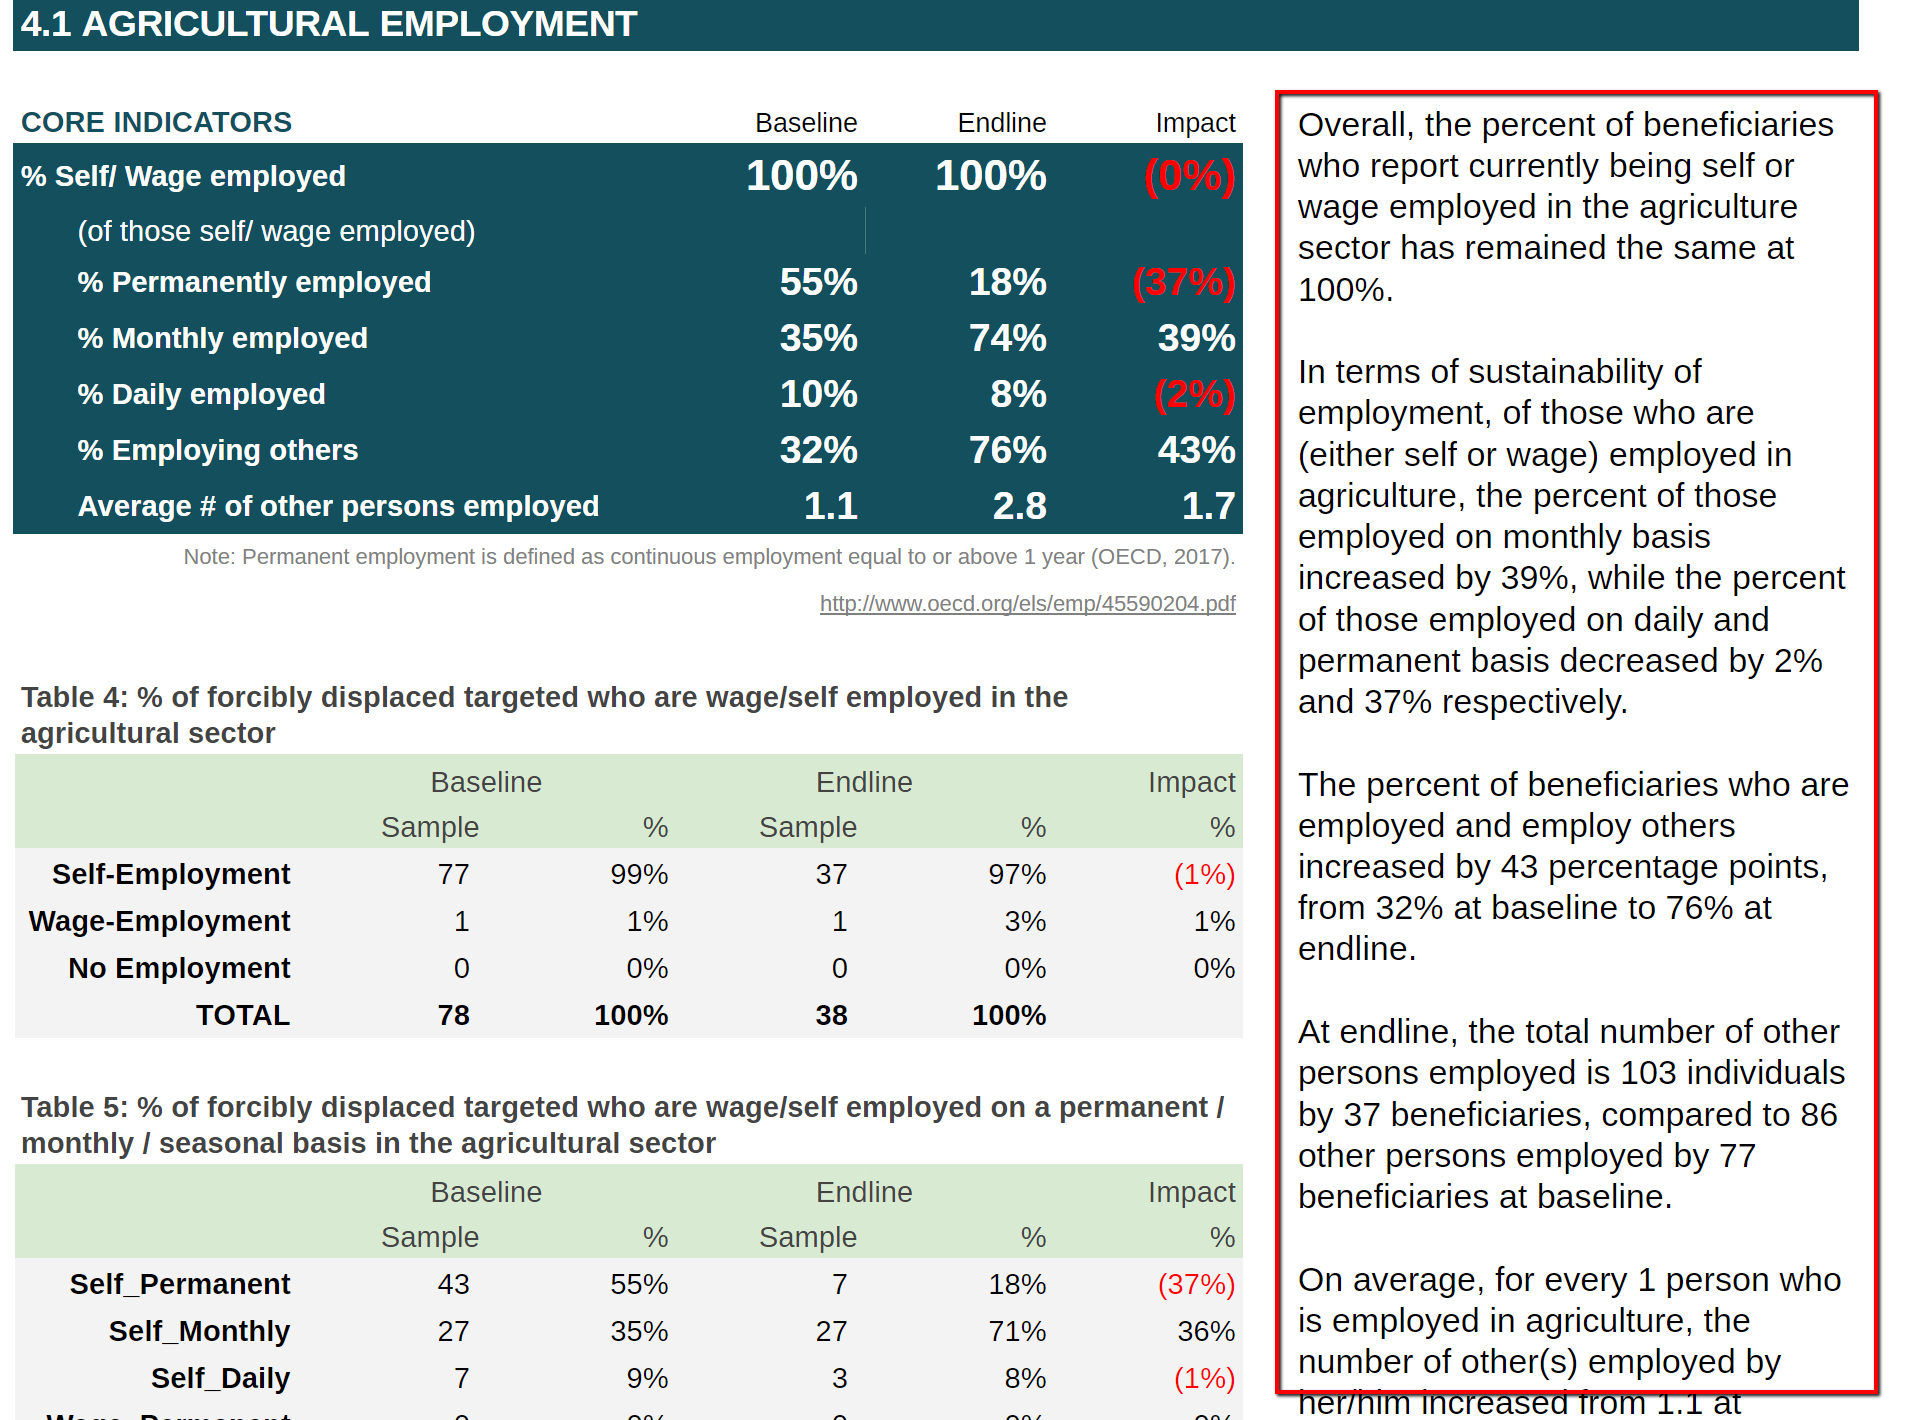
Screenshot of narrative
1 2 3 4 5 6 7 8 9 10 11 12 13 14 15 16 17 18 19 20 21 22 23 24 25 26 27 28 29 30 31 32 33 34 35 36 37 38 39 40 41 42 43 44 45 46 47 48 49 50 51 52 53 54 55 56 57 58 59 60 61 62 63 64 65 66 67 68 69 70 71 72 73 74 75 76 77 78 79 80 81 82 83 84 85 86 87 88 89 90 91 92 93 94 95 96 97 98 99 100 101 102 103 104 105 106 107 108 109 110 111 112 113 114 115 116 117 118 119 120 121 122 123 124 125 126 127 128 129 130 131 132 133 134 135 136 137 138 139 140 141 142 143 144 145 146 147 148 149 150 151 152 153 154 155 156 157 158 159 160 161 162 163 164 165 166 167 168 169 170 171 172 173 174 175 176 177 178 179 180 181 182 183 184 185 186 187 188 189 190 191 192 193 194 195 196 197 198 199 200 201 202 203 204 205 206 207 208 209 | t1 = "wage-employed";
}
text = text.replace("<1>", t1);
var t = table[8][3];
table[8][3] = 0;
table = sortTable(table, 3);
if (table[2][0].indexOf("Permanent") > -1) {
t1 = "permanent";
}
if (table[2][0].indexOf("Monthly") > -1) {
t1 = "monthly";
}
if (table[2][0].indexOf("Daily") > -1) {
t1 = "daily";
}
text = text.replace("<2>", t1);
table[8][3] = t;
t1 = Math.round(table3[2][4] * 100) + "%";
text = text.replace("<3>", t1);
var t = table2[6][3];
table2[6][3] = 0;
table = sortTable(table2, 3);
t1 = table[2][0].toLowerCase();
t1 = t1 + " - " + Math.round(table[2][4] * 100) + "%";
text = text.replace("<4>", t1);
table2[6][3] = t;
}
mergeText(y, x, 31, text);
}
/**
* The function generates the narrative for 4.1 AGRICULTURAL EMPLOYMENT
* @param {string} y - row
* @param {string} x - column
* @param {string} tn - number of the table
*/
function displayNarrativeIndicator41a(y, x, z) {
if (totaloutputel > 0 && totaloutputbl > 0) {
text = "Overall, the percent of beneficiaries who report currently being self or wage employed in the agriculture sector has <1> by <2> percentage points from <3> at baseline to <33> at endline.";
if (Math.round((table2[2][4] + table2[3][4]) * 100) != 0) {
text = text + String.fromCharCode(10) + String.fromCharCode(10) + "In terms of sustainability of employment, of those who are (either self or wage) employed in agriculture, " + "<4>" + String.fromCharCode(10) + String.fromCharCode(10) + "The percent of beneficiaries who are employed and employ others <5> by <6> percentage points, from <7> at baseline to <8> at endline." + String.fromCharCode(10) + String.fromCharCode(10) + "At endline, the total number of other persons employed is <9>, compared to <11> at baseline." + String.fromCharCode(10) + String.fromCharCode(10) +
"On average, for every 1 person who is employed in agriculture, the number of other(s) employed by her/him <12> from <13> at baseline to <14> at endline.";
}
if (Math.round((table2[2][5] + table2[3][5]) * 100) == 0) {
text = text.replace("<1>", "remained the same at " + Math.abs(Math.round((table2[2][4] + table2[3][4]) * 100)) + "%");
text = text.replace(" by <2> percentage points from <3> at baseline to <33> at endline", "");
}
else {
if ((table2[2][5] + table2[3][5]) > 0) {
text = text.replace("<1>", "increased")
} else {
text = text.replace("<1>", "decreased")
}
text = text.replace("<2>", Math.abs(Math.round(((table2[2][4] + table2[3][4]) - (table2[2][2] + table2[3][2])) * 100)));
text = text.replace("<3>", Math.round((table2[2][2] + table2[3][2]) * 100) + "% (self - " + Math.round((table2[2][2]) * 100) + "%, wage - " + Math.round((table2[3][2]) * 100) + "%)");
text = text.replace("<33>", Math.round((table2[2][4] + table2[3][4]) * 100) + "% (self - " + Math.round((table2[2][4]) * 100) + "%, wage - " + Math.round((table2[3][4]) * 100) + "%)");
}
/*generates the value for Table : % of forcibly displaced targeted who are wage/self employed on a permanent / monthly / seasonal basis in the agricultural sector*/
var tttb = generateTableIndicator41AgrEmpl([['Self_Permanent', 'Wage_Permanent'], ['Self_Monthly', 'Wage_Monthly'], ['Self_Daily', 'Wage_Daily']], ['permanent', 'monthly', 'daily'], jsonData, "G_OUTPUT1/O1_Agricultural_Employment/O1_Employment_Sustainability");
table = sortTable(tttb, 5);
var inc = 0;
var dc = 0;
var t1, t2, t3, t4;
for (s = 1; s < 4; s++) {
if (Math.round(table[s][5] * 100) > 0) {
if (inc == 0) {
t1 = "the percent of those employed on " + table[s][0];
t2 = "by " + Math.round(table[s][5] * 100) + "%";
}
if (inc > 0) {
t1 = t1 + " and " + table[s][0];
t2 = t2 + " and " + Math.round(table[s][5] * 100) + "% respectively";
}
inc++;
}
if (Math.round(table[s][5] * 100) < 0) {
if (dc == 0) {
t3 = ", while the percent of those employed on " + table[s][0];
t4 = "by " + Math.abs(Math.round(table[s][5] * 100)) + "%";
}
if (dc > 0) {
t3 = t3 + " and " + table[s][0];
t4 = t4 + " and " + Math.abs(Math.round(table[s][5] * 100)) + "% respectively";
}
dc++;
}
}
t1 = t1 + " basis";
t3 = t3 + " basis";
if (table[2][5] != "") {
text = text.replace("<4>", t1 + " increased " + t2 + t3 + " decreased " + t4 + ".");
} else { text = text.replace("In terms of sustainability of employment, of those who are (either self or wage) employed in agriculture, " + "<4>" + String.fromCharCode(10) + String.fromCharCode(10), ""); }
if (Math.round(table3[2][4] * 100) == Math.round(table3[2][2] * 100)) {
text = text.replace("<5>", "remained the same at " + Math.abs(Math.round((table3[2][4]) * 100)) + "%");
text = text.replace(" by <6> percentage points, from <7> at baseline to <8> at endline", "");
}
else {
if (table3[2][4] > table3[2][2]) {
text = text.replace("<5>", "increased")
} else {
text = text.replace("<5>", "decreased")
}
text = text.replace("<6>", Math.abs(Math.round((table3[2][4] - table3[2][2]) * 100)));
text = text.replace("<7>", Math.round((table3[2][2]) * 100) + "%");
text = text.replace("<8>", Math.round((table3[2][4]) * 100) + "%");
}
text = text.replace("<9>", table4[6][3] + " individuals by " + table2[2][3] + " beneficiaries");
text = text.replace("<11>", table4[6][1] + " other persons employed by " + table2[2][1] + " beneficiaries");
var self = table2[2][2];
var self2 = table2[2][4];
var baseAverageOthers = 0;
if (totaloutputbl * self != 0) { baseAverageOthers = totaloutputbl * self; }
var endAverageOthers = 0;
if (totaloutputel * self2 != 0) { var endAverageOthers = totaloutputel * self2; }
if (endAverageOthers > baseAverageOthers) {
text = text.replace("<12>", "increased")
} else {
text = text.replace("<12>", "decreased")
}
text = text.replace("<13>", String(Math.round((baseAverageOthers) * 10) / 10));
text = text.replace("<14>", String(Math.round((endAverageOthers) * 10) / 10));
}
else if (totaloutputel == 0 && totaloutputbl > 0) {
text = "At baseline, <0> of beneficiaries surveyed at baseline report currently being self or wage employed.";
if (Math.round((table2[2][2] + table2[3][2]) * 100) != 0) {
text = text + String.fromCharCode(10) + String.fromCharCode(10) + "Of these, the majority of beneficiaries who are employed (either self (<11>) or wage (<12>)) in agriculture report being employed on a <1>; " + "while the second largest number of beneficiaries report being employed on a <2>" +
String.fromCharCode(10) + String.fromCharCode(10) + "Of the <3> people surveyed at baseline, <4> report they employ others and the total number of other persons employed is <5> individuals." +
" For every 1 person who is employed in agriculture, s/he reports employing <6> other(s) at baseline.";
}
text = text.replace("<0>", Math.round((table2[2][2] + table2[3][2]) * 100) + "%");
var tttb = generateTableIndicator41AgrEmpl([['Self_Permanent', 'Wage_Permanent'], ['Self_Monthly', 'Wage_Monthly'], ['Self_Daily', 'Wage_Daily']], ['permanent', 'monthly', 'daily'], jsonData, "G_OUTPUT1/O1_Agricultural_Employment/O1_Employment_Sustainability");
tttb[4][1] = -10;
table = sortTable(tttb, 1);
var r1 = table[1][2]*1000 / 10;
var r2 = Math.round(r1);
var r3 = String(r2).replace(/(\d)(?=(\d{3})+(?!\d))/g, '$1,');
t1 = table[1][0] + " contract - " + r3 + "%";
text = text.replace("<1>", t1);
if (table[2][2] > 0) {
r1 = table[2][2]*1000 / 10;
r2 = Math.round(r1);
r3 = String(r2).replace(/(\d)(?=(\d{3})+(?!\d))/g, '$1,');
t1 = table[2][0] + " contract - " + r3 + "%.";
text = text.replace("<2>", t1);
} else { text = text.replace("; while the second largest number of beneficiaries report being employed on a <2>", ".") }
text = text.replace("<3>", totaloutputbl);
t1 = Math.round(table3[2][2] * 100) + "%";
text = text.replace("<4>", t1);
if (Math.round(table3[2][2] * 100) == 0) {
text = text.replace(" and the total number of other persons employed is <5> individuals." + " For every 1 person who is employed in agriculture, s/he reports employing <6> other(s) at baseline", "");
}
text = text.replace("<5>", table4[6][1]);
var self = table2[2][2];
if (totaloutputbl * self > 0) { t1 = String(Math.round(table4[6][1] / (totaloutputbl * self) * 10) / 10); } else { t1 = 0; }
text = text.replace("<6>", t1);
text = text.replace("<11>", Math.round(table2[2][2] * 100) + "%");
text = text.replace("<12>", Math.round(table2[3][2] * 100) + "%");
}
else if (totaloutputel > 0 && totaloutputbl == 0) {
text = "At endline, <0> of beneficiaries surveyed report currently being self or wage employed.";
if (Math.round((table2[2][4] + table2[3][4]) * 100) != 0) {
text = text + String.fromCharCode(10) + String.fromCharCode(10) + "Of these, the majority of beneficiaries who are employed (either self (<11>) or wage (<12>)) in agriculture report being employed on a <1>; " +
|
Function displayNarrativeIndicator42Farming
-
displayNarrativeIndicator42Farming(y, x, tn)¶ The function generates the narrative (farming) for 4.2 AGRICULTURAL PRODUCTIVITY
- Arguments
y (string) – row
x (string) – column
tn (string) – number of the table
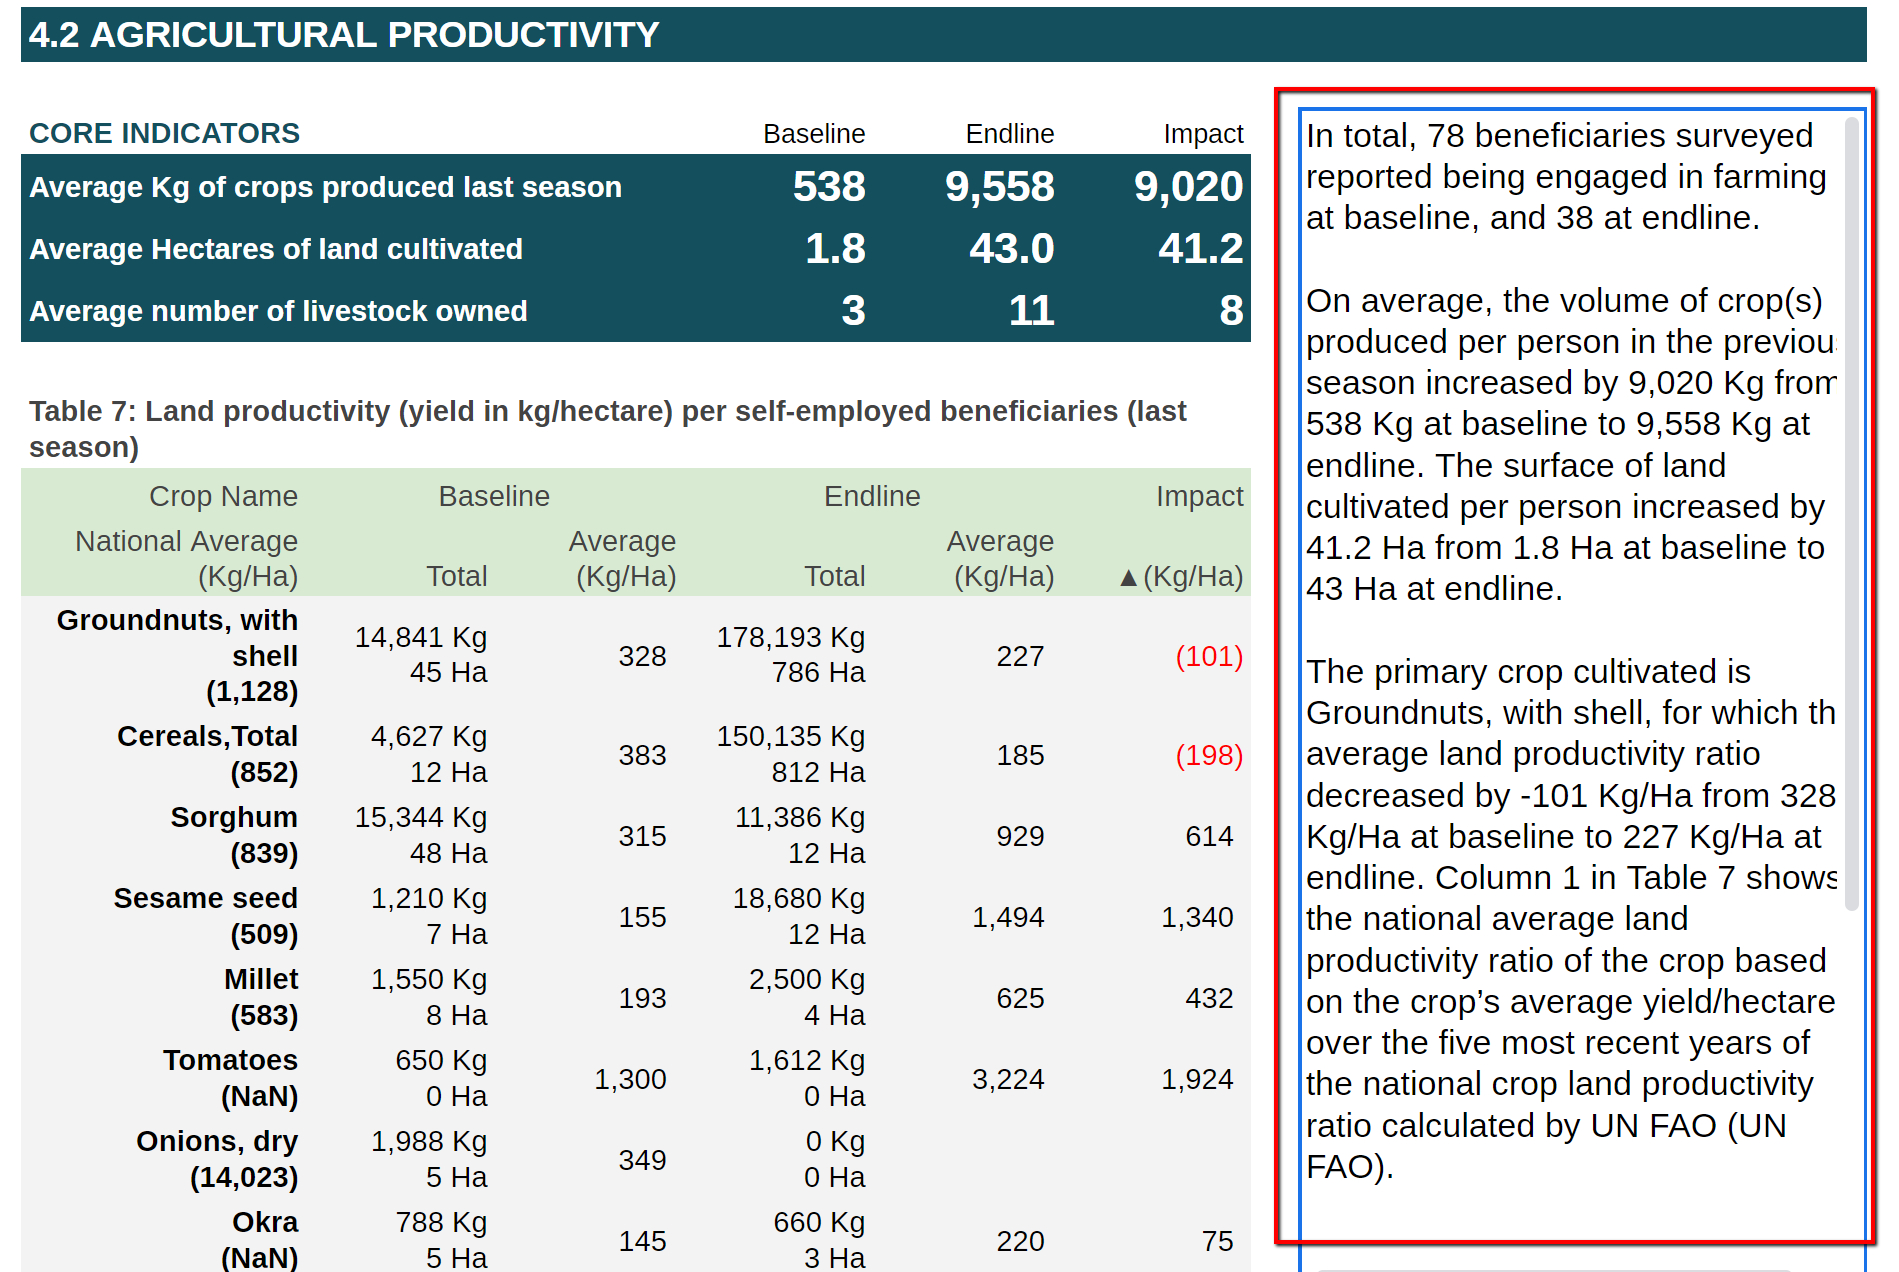
Screenshot of narrative
1 2 3 4 5 6 7 8 9 10 11 12 13 14 15 16 17 18 19 20 21 22 23 24 25 26 27 28 29 30 31 32 33 34 35 36 37 38 39 40 41 42 43 44 45 46 47 48 49 50 51 52 53 54 55 56 57 58 59 60 61 62 63 64 65 66 67 68 69 70 71 72 73 74 75 76 77 78 79 80 81 82 83 84 85 86 87 88 89 90 91 92 93 94 95 96 97 98 99 100 101 102 103 104 105 106 107 108 109 110 111 112 113 114 115 116 117 118 119 120 121 122 123 124 125 126 127 128 129 130 131 132 133 134 135 136 137 138 139 140 141 142 143 144 145 146 147 148 149 150 151 152 153 | tttb[4][3] = -10;
table = sortTable(tttb, 3);
var r1 = table[1][4]*1000 / 10;
var r2 = Math.round(r1);
var r3 = String(r2).replace(/(\d)(?=(\d{3})+(?!\d))/g, '$1,');
t1 = table[1][0] + " contract - " + r3 + "%";
text = text.replace("<1>", t1);
if (table[2][4] > 0) {
r1 = table[2][4]*1000 / 10;
r2 = Math.round(r1);
r3 = String(r2).replace(/(\d)(?=(\d{3})+(?!\d))/g, '$1,');
t1 = table[2][0] + " contract - " + r3 + "%.";
text = text.replace("<2>", t1);
} else { text = text.replace("; while the second largest number of beneficiaries report being employed on a <2>", ".") }
text = text.replace("<3>", totaloutputel);
t1 = Math.round(table3[2][4] * 100) + "%";
text = text.replace("<4>", t1);
if (Math.round(table3[2][4] * 100) == 0) {
text = text.replace(" and the total number of other persons employed is <5> individuals." + " For every 1 person who is employed in agriculture, s/he reports employing <6> other(s) at endline", "");
}
text = text.replace("<5>", table4[6][3]);
var self = table[2][4] + table[3][4] + table[4][4];
if (totaloutputel * self > 0) { t1 = String(Math.round(table4[6][3] / (totaloutputel * self) * 10) / 10); } else { t1 = 0; }
text = text.replace("<6>", t1);
text = text.replace("<11>", Math.round(table2[2][4] * 100) + "%");
text = text.replace("<12>", Math.round(table2[3][4] * 100) + "%");
}
}
/**
* The function generates the narrative (farming) for 4.2 AGRICULTURAL PRODUCTIVITY
* @param {string} y - row
* @param {string} x - column
* @param {string} tn - number of the table
*/
function displayNarrativeIndicator42Farming(y, x, z, tn) {
if (totaloutputel > 0 && totaloutputbl > 0) {
if (IndicatorYN('PRF1') == 1 && table2[2][1] > 0 && table2[2][3] > 0) {//FARMING
text = "In total, <1> beneficiaries surveyed reported being engaged in farming at baseline, and <2> at endline. " + String.fromCharCode(10) + String.fromCharCode(10) + "On average, the volume of crop(s) produced per person in the previous season <3> by <4> from <5> at baseline to <6> at endline. The surface of land cultivated per person <7> by <8> from <9> at baseline to <10> at endline.";
text = text.replace("<1>", table2[2][1]);
text = text.replace("<2>", table2[2][3]);
if (Math.round(eltotalkg / table2[2][3]) == Math.round(bltotalkg / table2[2][1])) {
text = text.replace("<3>", "remained the same at " + String(Math.round(bltotalkg / table2[2][1])).replace(/(\d)(?=(\d{3})+(?!\d))/g, '$1,') + " Kg");
text = text.replace(" by <4> from <5> at baseline to <6> at endline", "");
}
else {
if ((eltotalkg / table2[2][3] > bltotalkg / table2[2][1]) > 0) {
text = text.replace("<3>", "increased")
} else {
text = text.replace("<3>", "decreased")
}
text = text.replace("<4>", String(Math.abs(Math.round(eltotalkg / table2[2][3] - bltotalkg / table2[2][1]))).replace(/(\d)(?=(\d{3})+(?!\d))/g, '$1,') + " Kg");
text = text.replace("<5>", String(Math.round(bltotalkg / table2[2][1])).replace(/(\d)(?=(\d{3})+(?!\d))/g, '$1,') + " Kg");
text = text.replace("<6>", String(Math.round(eltotalkg / table2[2][3])).replace(/(\d)(?=(\d{3})+(?!\d))/g, '$1,') + " Kg");
}
if (Math.round((bltotalhc / table2[2][1]) * 10) == Math.round((eltotalhc / table2[2][3]) * 10)) {
text = text.replace("<7>", "remained the same at " + String(Math.round((bltotalhc / table2[2][1]) * 10) / 10).replace(/(\d)(?=(\d{3})+(?!\d))/g, '$1,') + " Ha");
text = text.replace(" by <8> from <9> at baseline to <10> at endline", "");
}
else {
if ((eltotalhc / table2[2][3] > bltotalhc / table2[2][1]) > 0) {
text = text.replace("<7>", "increased")
} else {
text = text.replace("<7>", "decreased")
}
text = text.replace("<8>", String(Math.abs(Math.round((eltotalhc / table2[2][3] - bltotalhc / table2[2][1]) * 10) / 10)) + " Ha");
text = text.replace("<9>", String(Math.round((bltotalhc / table2[2][1]) * 10) / 10).replace(/(\d)(?=(\d{3})+(?!\d))/g, '$1,') + " Ha");
text = text.replace("<10>", String(Math.round((eltotalhc / table2[2][3]) * 10) / 10).replace(/(\d)(?=(\d{3})+(?!\d))/g, '$1,') + " Ha");
}
text = text + String.fromCharCode(10) + String.fromCharCode(10) + "The primary crop cultivated is <11>, for which the average land productivity ratio <12> by <122> from <13> at baseline to <14> at endline." + "<SC>" + " Column 1 in Table " + tn + " shows the national average land productivity ratio of the crop based on the crop’s average yield/hectare over the five most recent years of the national crop land productivity ratio calculated by UN FAO (UN FAO).";
var fc = table3[2][0].splitCells("(");
text = text.replace("<11>", fc[0].replace(/[\n\r]/g, "").toLowerCase());
if (Math.round(table3[2][5]) == Math.round(table3[2][2])) {
text = text.replace("<12>", "remained the same at " + String(Math.round(table3[2][5])).replace(/(\d)(?=(\d{3})+(?!\d))/g, '$1,') + " Kg/Ha");
text = text.replace(" by <122> from <13> at baseline to <14> at endline", "");
}
else {
if ((table3[2][4] > table3[2][2]) > 0) {
text = text.replace("<12>", "increased")
} else {
text = text.replace("<12>", "decreased")
}
text = text.replace("<122>", String(Math.round(table3[2][5])).replace(/(\d)(?=(\d{3})+(?!\d))/g, '$1,') + " Kg/Ha");
text = text.replace("<13>", String(Math.round(table3[2][2])).replace(/(\d)(?=(\d{3})+(?!\d))/g, '$1,') + " Kg/Ha");
text = text.replace("<14>", String(Math.round(table3[2][4])).replace(/(\d)(?=(\d{3})+(?!\d))/g, '$1,') + " Kg/Ha");
}
}
text = text.replace("<SC>", "");
mergeText(y, x, z, text, 3);
}
else if (totaloutputel == 0 && totaloutputbl > 0) {
if (IndicatorYN('PRF1') == 1 && farmingtotal - zerofarmingtotal > 0) {
text = "At baseline, <1> beneficiaries surveyed reported being engaged in farming.";
}
if (IndicatorYN('PRF1') == 1 && farmingtotal - zerofarmingtotal > 0) {
text = text + " When asked at baseline, they cultivated on average <3> Kg of crops on <4> Ha of land per person in the previous season.";
}
if (IndicatorYN('PRF1') == 1 && farmingtotal - zerofarmingtotal > 0) {
text = text + String.fromCharCode(10) + String.fromCharCode(10) + "The primary crop cultivated is <6>, with a total production of <7> Kg on <8> Ha of land, resulting in an average land productivity of <9> Kg/Ha." + // (National standard was <10>."+
"<SC>" +
" Column 1 in Table " + tn + " shows the national average land productivity ratio of the crop based on the crop’s average yield/hectare over the five most recent years of the national crop land productivity ratio calculated by UN FAO (UN FAO)."; // (National standard was <15>).";}
text = text.replace("<1>", totalfaming);
Logger.log(String(totalcrophc / table2[2][1]));
text = text.replace("<3>", String(Math.round(bltotalkg / table2[2][1])).replace(/(\d)(?=(\d{3})+(?!\d))/g, '$1,'));
text = text.replace("<4>", String(Math.round((bltotalhc / table2[2][1]) * 10) / 10).replace(/(\d)(?=(\d{3})+(?!\d))/g, '$1,'));
text = text.replace("<5>", totalaveragelivestock);
text = text.replace("<6>", firstcrop[0].replace(/[\n\r]/g, "").toLowerCase());
text = text.replace("<7>", String(firstcropkg).replace(/(\d)(?=(\d{3})+(?!\d))/g, '$1,'));
text = text.replace("<8>", String(firstcrophc).replace(/(\d)(?=(\d{3})+(?!\d))/g, '$1,'));
text = text.replace("<9>", String(firstcropratio).replace(/(\d)(?=(\d{3})+(?!\d))/g, '$1,'));
text = text.replace("<10>", firstcropnational);
if (table3.length > 7) {
text = text.replace("<SC>", "The secondary crop is <11>, with total production of <12> Kg on <13> Ha, resulting in the average land productivity of <14> Kg/Ha. ");
text = text.replace("<11>", secondcrop[0].replace(/[\n\r]/g, ""));
text = text.replace("<12>", String(secondcropkg).replace(/(\d)(?=(\d{3})+(?!\d))/g, '$1,'));
text = text.replace("<13>", String(secondcrophc).replace(/(\d)(?=(\d{3})+(?!\d))/g, '$1,'));
text = text.replace("<14>", String(secondcropratio).replace(/(\d)(?=(\d{3})+(?!\d))/g, '$1,'));
text = text.replace("<15>", secondcropnational);
}
text = text.replace("<SC>", "");
mergeText(y, x, z, text, 3);
} else if (farmingtotal - zerofarmingtotal == 0 && farmingtotal > 0) {
|
Function displayNarrativeIndicator42Livestock
-
displayNarrativeIndicator42Livestock(y, x, tn)¶ The function generates the narrative (Livestock and fish) for 4.2 AGRICULTURAL PRODUCTIVITY
- Arguments
y (string) – row
x (string) – column
tn (string) – number of the table
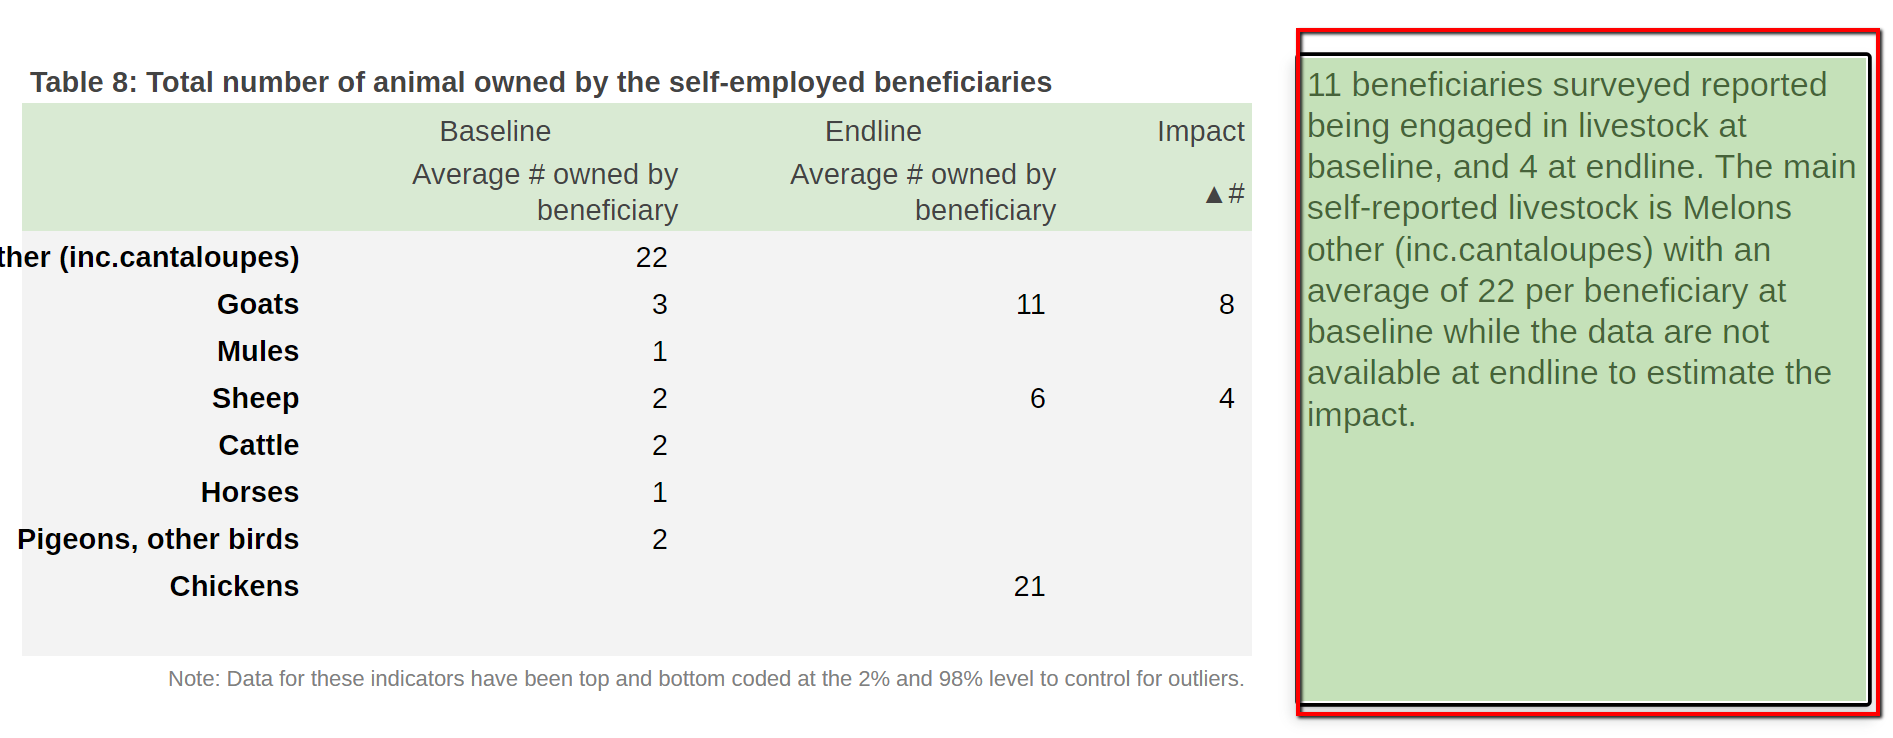
Screenshot of narrative
1 2 3 4 5 6 7 8 9 10 11 12 13 14 15 16 17 18 19 20 21 22 23 24 25 26 27 28 29 30 31 32 33 34 35 36 37 38 39 40 41 42 43 44 45 46 47 48 49 50 51 52 53 54 55 56 57 58 59 60 61 62 63 64 65 66 67 68 69 70 71 72 73 74 75 76 77 78 79 80 81 82 83 84 85 86 87 88 89 90 91 92 93 94 95 96 97 98 99 100 101 102 103 104 105 106 107 108 109 110 111 112 113 114 115 116 117 118 119 120 121 | text = "At endline, <1> beneficiaries surveyed reported being engaged in farming.";
}
if (IndicatorYN('PRF1') == 1 && farmingtotal - zerofarmingtotal > 0) {
text = text + " When asked at endline, they cultivated on average <3> Kg of crops on <4> Ha of land per person in the previous season.";
}
if (IndicatorYN('PRF1') == 1 && farmingtotal - zerofarmingtotal > 0) {
text = text + String.fromCharCode(10) + String.fromCharCode(10) + "The primary crop cultivated is <6>, with a total production of <7> Kg on <8> Ha of land, resulting in an average land productivity of <9> Kg/Ha." + // (National standard was <10>."+
"<SC>" +
" Column 1 in Table " + tn + " shows the national average land productivity ratio of the crop based on the crop’s average yield/hectare over the five most recent years of the national crop land productivity ratio calculated by UN FAO (UN FAO)."; // (National standard was <15>).";}
text = text.replace("<1>", table2[2][3]);
Logger.log(String(totalcrophc / table2[2][1]));
text = text.replace("<3>", String(Math.round(eltotalkg / table2[2][3])).replace(/(\d)(?=(\d{3})+(?!\d))/g, '$1,'));
text = text.replace("<4>", String(Math.round((eltotalhc / table2[2][3]) * 10) / 10).replace(/(\d)(?=(\d{3})+(?!\d))/g, '$1,'));
text = text.replace("<6>", firstcrop[0].replace(/[\n\r]/g, ""));
text = text.replace("<7>", String(firstcropkg).replace(/(\d)(?=(\d{3})+(?!\d))/g, '$1,'));
text = text.replace("<8>", String(firstcrophc).replace(/(\d)(?=(\d{3})+(?!\d))/g, '$1,'));
text = text.replace("<9>", String(firstcropratio).replace(/(\d)(?=(\d{3})+(?!\d))/g, '$1,'));
text = text.replace("<10>", firstcropnational);
if (table3.length > 7) {
text = text.replace("<SC>", "The secondary crop is <11>, with total production of <12> Kg on <13> Ha, resulting in the average land productivity of <14> Kg/Ha. ");
text = text.replace("<11>", secondcrop[0].replace(/[\n\r]/g, ""));
text = text.replace("<12>", String(secondcropkg).replace(/(\d)(?=(\d{3})+(?!\d))/g, '$1,'));
text = text.replace("<13>", String(secondcrophc).replace(/(\d)(?=(\d{3})+(?!\d))/g, '$1,'));
text = text.replace("<14>", String(secondcropratio).replace(/(\d)(?=(\d{3})+(?!\d))/g, '$1,'));
text = text.replace("<15>", secondcropnational);
}
text = text.replace("<SC>", "");
mergeText(y, x, z, text, 3);
}
}
}
/**
* The function generates the narrative (Livestock and fish) for 4.2 AGRICULTURAL PRODUCTIVITY
* @param {string} y - row
* @param {string} x - column
* @param {string} tn - number of the table
*/
function displayNarrativeIndicator42Livestock(y, x, z, tn) {
if (totaloutputel > 0 && totaloutputbl > 0) {
if (IndicatorYN('PRA1') == 1 && livestocktotal > 0) {
text = "<2> beneficiaries surveyed reported being engaged in livestock at baseline, and <22> at endline." +
" The main self-reported livestock is <16><17>.";
var ff;
for (f = 2; f < table2.length; f++) {
if (table2[f][0] == "Livestock") {
ff = f;
}
}
text = text.replace("<2>", table2[ff][1]);
text = text.replace("<22>", table2[ff][3]);
text = text.replace("<16>", firstlivestock.toLowerCase());
if (table3[2][5] != "") {
text = text.replace("<17>", " with <171> of the average by <172> from <173> at baseline to <174> at endline");
if (table3[2][5] > 0) {
text = text.replace("<171>", "an increase");
} else {
text = text.replace("<171>", "a decrease");
}
text = text.replace("<172>", Math.abs(Math.round(table3[2][5])));
text = text.replace("<173>", Math.round(table3[2][2]));
text = text.replace("<174>", Math.round(table3[2][4]));
} else {
text = text.replace("<17>", " with an average of " + Math.round(firstaveragelivestock) + " per beneficiary at baseline while the data are not available at endline to estimate the impact");
}
}
if (IndicatorYN('PRFISH1') == 1) {
//text = text + String.fromCharCode(10) + String.fromCharCode(10) + "<2> beneficiaries surveyed reported being engaged in fishery at baseline, and <22> at endline, and the average number of fish produce <3> by <4> from <5> at baseline to <6> at endline.";
var ff;
for (f = 2; f < table2.length; f++) {
if (table2[f][0] == "Fishery") {
ff = f;
}
}
if (table2[ff][1] > 0 && table2[ff][3] > 0) {
text = text + String.fromCharCode(10) + String.fromCharCode(10) + "<2> beneficiaries surveyed reported being engaged in fishery at baseline, and <22> at endline, and the average number of fish produce <3> by <4> from <5> at baseline to <6> at endline.";
}
text = text.replace("<2>", table2[ff][1]);
text = text.replace("<22>", table2[ff][3]);
if (table[2][2] == table[2][4]) {
text = text.replace("<3>", "remained the same at " + table[2][2] + " Kg");
text = text.replace(" by <4> from <5> at baseline to <6> at endline", "");
}
else {
if (table[2][4] > table[2][2]) {
text = text.replace("<3>", "increased");
} else {
text = text.replace("<3>", "decreased");
}
text = text.replace("<4>", Math.abs(table[2][4] - table[2][2]) + " Kg");
text = text.replace("<5>", table[2][2] + " Kg");
text = text.replace("<6>", table[2][4] + " Kg");
}
if (table2[ff][1] > 0 && table2[ff][3] == 0)
{
text = text + String.fromCharCode(10) + String.fromCharCode(10) + "At baseline, <22> beneficiaries surveyed reported being engaged in fishery, and the average number of fish produce was <55> Kg."
t1 = Math.round(fishtotal / fishbene);
text = text.replace("<22>", fishbene);
text = text.replace("<55>", t1);
}
if (table2[ff][1] == 0 && table2[ff][3] > 0)
{
text = text + String.fromCharCode(10) + String.fromCharCode(10) + "At endline, <22> beneficiaries surveyed reported being engaged in fishery, and the average number of fish produce was <55> Kg."
|
Function displayNarrativeIndicator43Income
-
displayNarrativeIndicator43Income(y, x, z)¶ The function generates the narrative331 (2, Income) for 4.3 INCOME/SAVING GAINED FROM AGRICULTURE
- Arguments
y (string) – row
x (string) – column
z (string) – position
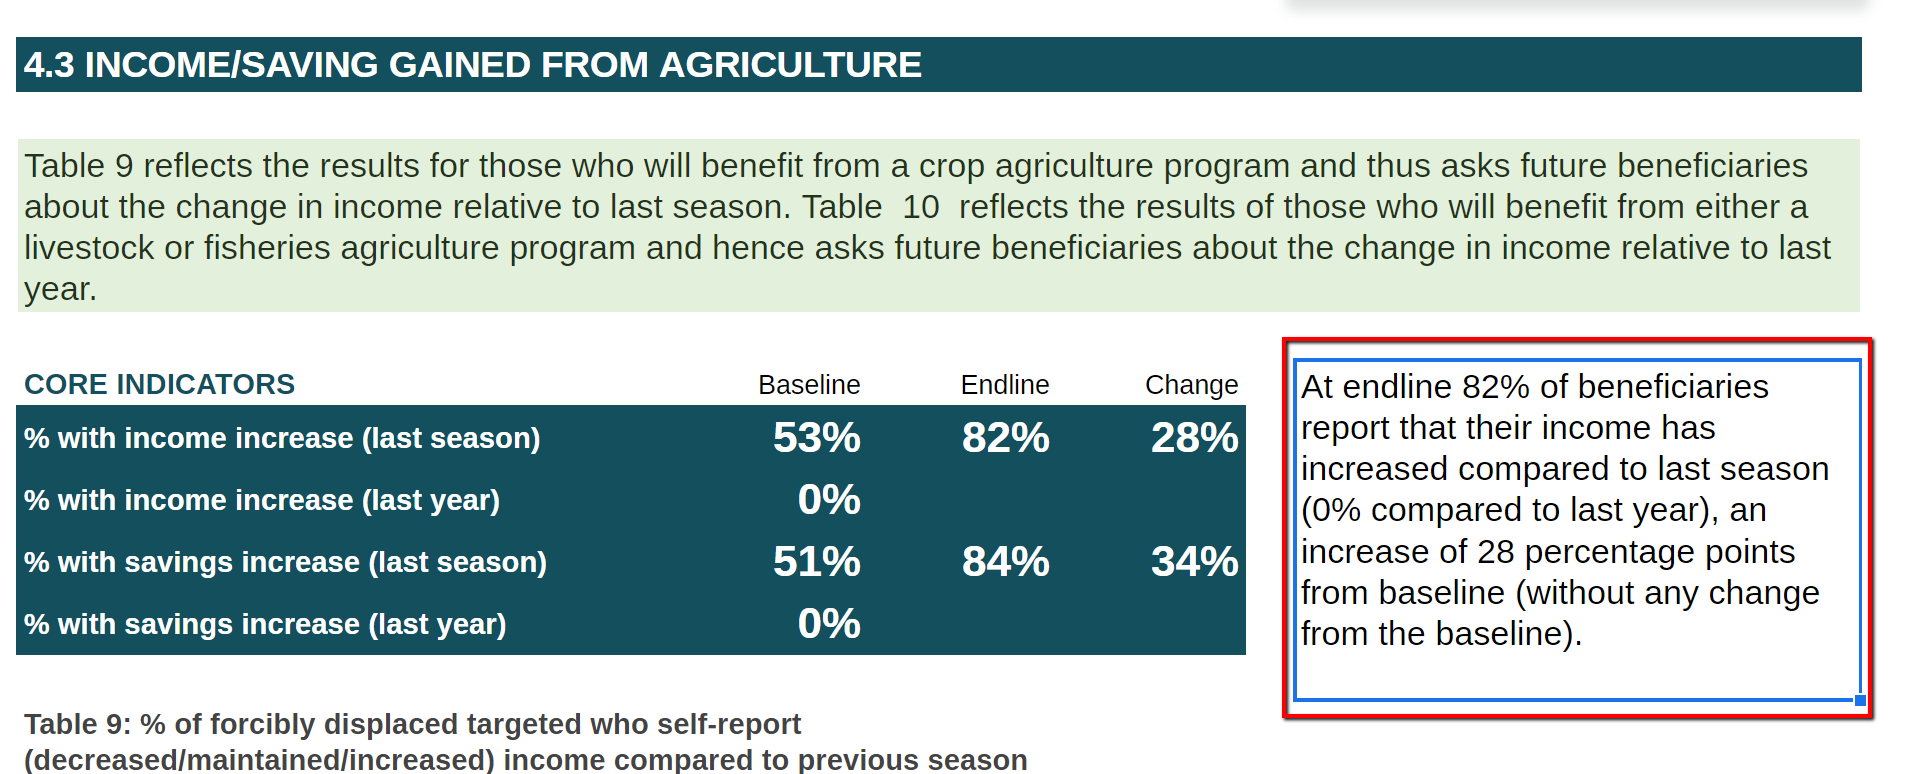
Screenshot of narrative
1 2 3 4 5 6 7 8 9 10 11 12 13 14 15 16 17 18 19 20 21 22 23 24 25 26 27 28 29 30 31 32 33 34 35 36 37 38 39 40 41 42 43 44 45 46 47 48 49 50 51 52 53 54 55 56 57 58 59 60 61 62 63 64 65 66 67 68 69 70 71 72 73 74 75 76 77 78 79 80 81 82 | if (IndicatorYN('PRA1') == 1 && livestocktotal > 0) {
text = "At baseline, <2> beneficiaries surveyed reported being engaged in livestock<555>." +
" The main self-reported livestock is <16>, with an average of <18> per beneficiary.";
if (table.length > 4) {
text = text.replace("<555>", ", and the average number of livestock owned was <5>")
} else {
text = text.replace("<555>", "")
};
text = text.replace("<2>", totallivestock);
text = text.replace("<5>", Math.round(blaverageanimal / blbene));
text = text.replace("<16>", firstlivestock.toLowerCase());
text = text.replace("<18>", Math.round(firstaveragelivestock));
}
if (IndicatorYN('PRFISH1') == 1 && fisherytotal > 0) {
text = text + String.fromCharCode(10) + String.fromCharCode(10) + "At baseline, <22> beneficiaries surveyed reported being engaged in fishery, and the average number of fish produce was <55> Kg."
t1 = Math.round(fishtotal / fishbene);
text = text.replace("<22>", fishbene);
text = text.replace("<55>", t1);
}
}
else if (totaloutputel > 0 && totaloutputbl == 0) {
if (IndicatorYN('PRA1') == 1 && livestocktotal > 0) {
text = "At endline, <2> beneficiaries surveyed reported being engaged in livestock<555>." +
" The main self-reported livestock is <16>, with an average of <18> per beneficiary.";
if (table.length > 4) {
text = text.replace("<555>", ", and the average number of livestock owned was <5>")
} else {
text = text.replace("<555>", "")
};
for (f = 2; f < table2.length; f++) {
if (table2[f][0] == "Livestock") {
ff = f;
}
}
text = text.replace("<2>", table2[ff][3]);
text = text.replace("<5>", Math.round(elavarageanimal / elbene));
text = text.replace("<16>", firstlivestock.toLowerCase());
text = text.replace("<18>", Math.round(table3[2][4]));
}
if (IndicatorYN('PRFISH1') == 1 && fisherytotal > 0) {
text = text + String.fromCharCode(10) + String.fromCharCode(10) + "At endline, <22> beneficiaries surveyed reported being engaged in fishery, and the average number of fish produce was <55> Kg."
t1 = Math.round(fishtotal2 / fishbene2);
text = text.replace("<22>", fishbene2);
text = text.replace("<55>", t1);
}
}
mergeText(y, x, z, text, 3);
}
/**
* The function generates the narrative331 (2, Income) for 4.3 INCOME/SAVING GAINED FROM AGRICULTURE
* @param {string} y - row
* @param {string} x - column
* @param {string} z - position
*/
function displayNarrativeIndicator43Income(y, x, z) {
if (totaloutputel > 0) {
text = "At endline <1> of beneficiaries report that their income has increased compared to <2>. ";
if (IndicatorYN('PRF1') == 1) {
text = text.replace("<1>", Math.round(table[2][4] * 100) + "%");
text = text.replace("<2>", "last season<2>");
if (totaloutputbl != 0) {
if (Math.round(table[2][2] * 100) == Math.round(table[2][4] * 100)) {
text = text.replace("<2>", "<2> without any change from the baseline<22>");
}
else {
if (Math.round(table[2][4] * 100) > Math.round(table[2][2] * 100)) {
|
Function displayNarrativeIndicator43Saving
-
displayNarrativeIndicator43Saving(y, x, z)¶ The function generates the narrative(3, Saving) for 4.3 INCOME/SAVING GAINED FROM AGRICULTURE
- Arguments
y (string) – row
x (string) – column
z (string) – position

Screenshot of narrative
1 2 3 4 5 6 7 8 9 10 11 12 13 14 15 16 17 18 19 20 21 22 23 24 25 26 27 28 29 30 31 32 33 34 35 36 37 38 39 40 41 42 43 44 45 46 47 48 49 50 51 52 53 54 55 56 57 58 59 60 61 62 63 64 65 66 67 68 69 70 71 72 73 74 75 76 77 78 79 80 81 82 | if (IndicatorYN('PRF1') == 1 && countTotalNumCategoryIndicator2Agr(jsonData, 'G_OUTPUT1/O1_IncomeSaving/O1_Income', [['Decreased'], ['Same'], ['Increased']], "ALL", "1") > 0) {
text = text.replace("<2>", " (" + Math.round(table2[2][4] * 100) + "% compared to last year)");
if (Math.round(table2[2][2] * 100) == Math.round(table2[2][4] * 100)) {
text = text.replace("<22>", " (without any change from the baseline)");
}
else {
if (Math.round(table2[2][4] * 100) > Math.round(table2[2][2] * 100)) {
text = text.replace("<22>", " (an increase of " + Math.abs(Math.round((table2[2][4] - table2[2][2]) * 100)) + " percentage points from baseline)")
} else {
text = text.replace("<22>", " (a decrease of " + Math.abs(Math.round((table2[2][4] - table2[2][2]) * 100)) + " percentage points from baseline)")
}
}
} else if (countTotalNumCategoryIndicator2Agr(jsonData, 'G_OUTPUT1/O1_IncomeSaving/O1_Income', [['Decreased'], ['Same'], ['Increased']], "ALL", "1") > 0) {
text = "At endline <1> of beneficiaries report that their income has increased compared to <2>. ";
text = text.replace("<1>", Math.round(table2[2][4] * 100) + "%");
text = text.replace("<2>", "last year<2>");
if (totaloutputbl != 0) {
if (Math.round(table2[2][2] * 100) == Math.round(table2[2][4] * 100)) {
text = text.replace("<2>", ",without any change from the baseline");
}
else {
if (Math.round(table2[2][4] * 100) > Math.round(table2[2][2] * 100)) {
text = text.replace("<2>", ", an increase of " + Math.abs(Math.round((table2[2][4] - table2[2][2]) * 100)) + " percentage points from baseline")
} else {
text = text.replace("<2>", ", a decrease of " + Math.abs(Math.round((table2[2][4] - table2[2][2]) * 100)) + " percentage points from baseline")
}
}
}
}
}
else {
text = "At baseline <1> of beneficiaries report that their income has increased compared to <2>. ";
if (IndicatorYN('PRF1') == 1) {
t1 = Math.round(table[2][2] * 100) + "%";
text = text.replace("<1>", t1);
t1 = "last season<2>";
text = text.replace("<2>", t1);
}
if (IndicatorYN('PRF1') == 1 && countTotalNumCategoryIndicator2Agr(jsonData, 'G_OUTPUT1/O1_IncomeSaving/O1_Income', [['Decreased'], ['Same'], ['Increased']], "ALL", "1") > 0) {
text = text.replace("<2>", " (" + Math.round(table2[2][2] * 100) + "% compared to last year)");
}
else if (countTotalNumCategoryIndicator2Agr(jsonData, 'G_OUTPUT1/O1_IncomeSaving/O1_Income', [['Decreased'], ['Same'], ['Increased']], "ALL", "1") > 0) {
text = text.replace("<1>", Math.round(table2[2][2] * 100) + "%");
text = text.replace("<2>", "last year");
}
}
text = text.replace("<1>", "");
text = text.replace("<2>", "");
text = text.replace("<22>", "");
mergeText(y, x, z, text);
}
/**
* The function generates the narrative(3, Saving) for 4.3 INCOME/SAVING GAINED FROM AGRICULTURE
* @param {string} y - row
* @param {string} x - column
* @param {string} z - position
*/
function displayNarrativeIndicator43Saving(y, x, z) {
if (totaloutputel > 0) {
text = "At endline <1> of beneficiaries report that their savings has increased compared to <2>. ";
if (IndicatorYN('PRF1') == 1) {
text = text.replace("<1>", Math.round(table3[2][4] * 100) + "%");
text = text.replace("<2>", "last season<2>");
if (totaloutputbl != 0) {
if (Math.round(table3[2][2] * 100) == Math.round(table3[2][4] * 100)) {
text = text.replace("<2>", "<2> without any change from the baseline<22>");
}
else {
if (Math.round(table3[2][4] * 100) > Math.round(table3[2][2] * 100)) {
text = text.replace("<2>", "<2>, an increase of " + Math.abs(Math.round((table3[2][4] - table3[2][2]) * 100)) + " percentage points from baseline<22>")
} else {
|
Function displayNarrativeIndicator51Employment
-
displayNarrativeIndicator51Employment(y, x, z)¶ The function generates the narrative(1) for 5.1 SELF-EMPLOYMENT [Need to double check]
- Arguments
y (string) – row
x (string) – column
z (string) – position
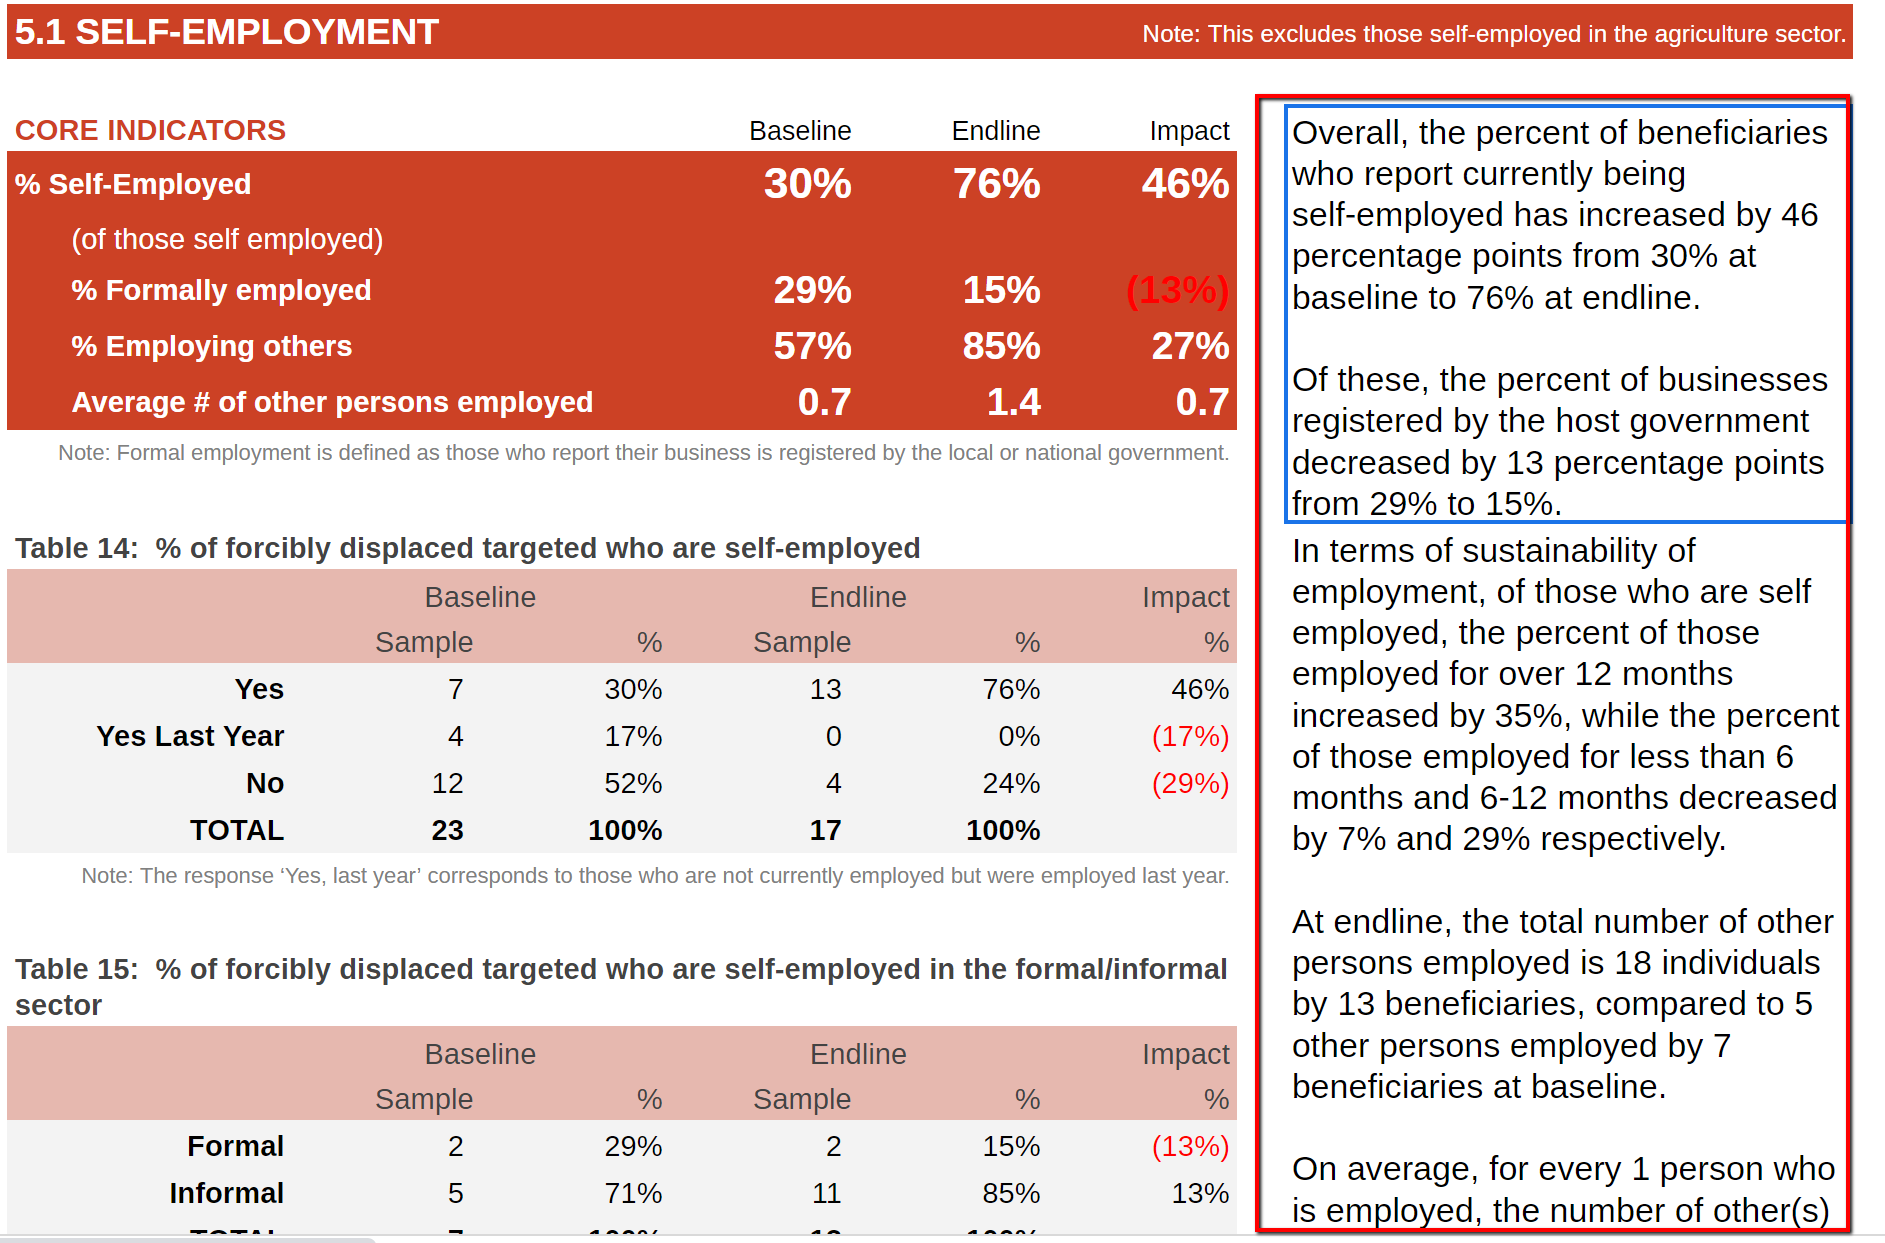
Screenshot of narrative
1 2 3 4 5 6 7 8 9 10 11 12 13 14 15 16 17 18 19 20 21 22 23 24 25 26 27 28 29 30 31 32 33 34 35 36 37 38 39 40 41 42 43 44 45 46 47 48 49 50 51 52 53 54 55 56 57 58 59 60 61 62 63 64 65 66 67 68 69 70 71 72 73 74 75 76 77 78 79 80 81 82 83 84 85 86 87 88 89 90 91 92 93 94 95 96 97 98 99 100 101 102 103 104 105 106 107 108 109 110 111 112 113 114 115 116 117 118 119 120 121 122 123 124 125 126 127 128 129 130 131 132 133 134 135 136 137 138 139 140 141 142 143 144 145 146 147 148 149 150 151 152 153 154 155 156 157 158 159 160 161 162 163 164 165 166 167 168 169 170 171 172 173 174 175 176 177 178 179 180 181 182 183 184 185 186 187 188 189 190 191 192 193 194 195 196 197 198 199 200 201 202 203 204 205 206 207 208 209 210 211 212 213 214 215 216 217 218 219 220 221 222 223 224 225 226 227 228 229 | if (Math.round(table4[2][2] * 100) == Math.round(table4[2][4] * 100)) {
text = text.replace("<22>", " (without any change from the baseline)");
}
else {
if (Math.round(table4[2][4] * 100) > Math.round(table4[2][2] * 100)) {
text = text.replace("<22>", " (an increase of " + Math.abs(Math.round((table4[2][4] - table4[2][2]) * 100)) + " percentage points from baseline)")
} else {
text = text.replace("<22>", " (a decrease of " + Math.abs(Math.round((table4[2][4] - table4[2][2]) * 100)) + " percentage points from baseline)")
}
}
} else if (countTotalNumCategoryIndicator2Agr(jsonData, 'G_OUTPUT1/O1_IncomeSaving/O1_Income', [['Decreased'], ['Same'], ['Increased']], "ALL", "1") > 0) {
text = "At endline <1> of beneficiaries report that their savings has increased compared to <2>. ";
text = text.replace("<1>", Math.round(table4[2][4] * 100) + "%");
text = text.replace("<2>", "last year<2>");
if (totaloutputbl != 0) {
if (Math.round(table4[2][2] * 100) == Math.round(table4[2][4] * 100)) {
text = text.replace("<2>", ",without any change from the baseline");
}
else {
if (Math.round(table4[2][4] * 100) > Math.round(table4[2][2] * 100)) {
text = text.replace("<2>", ", an increase of " + Math.abs(Math.round((table4[2][4] - table4[2][2]) * 100)) + " percentage points from baseline")
} else {
text = text.replace("<2>", ", a decrease of " + Math.abs(Math.round((table4[2][4] - table4[2][2]) * 100)) + " percentage points from baseline")
}
}
}
}
}
else {
text = "At baseline <1> of beneficiaries report that their savings has increased compared to <2>. ";
if (IndicatorYN('PRF1') == 1) {
t1 = Math.round(table3[2][2] * 100) + "%";
text = text.replace("<1>", t1);
t1 = "last season<2>";
text = text.replace("<2>", t1);
}
if (IndicatorYN('PRF1') == 1 && countTotalNumCategoryIndicator2Agr(jsonData, 'G_OUTPUT1/O1_IncomeSaving/O1_Income', [['Decreased'], ['Same'], ['Increased']], "ALL", "1") > 0) {
text = text.replace("<2>", " (" + Math.round(table4[2][2] * 100) + "% compared to last year)");
}
else if (countTotalNumCategoryIndicator2Agr(jsonData, 'G_OUTPUT1/O1_IncomeSaving/O1_Income', [['Decreased'], ['Same'], ['Increased']], "ALL", "1") > 0) {
text = text.replace("<1>", Math.round(table4[2][2] * 100) + "%");
text = text.replace("<2>", "last year");
}
}
text = text.replace("<1>", "");
text = text.replace("<2>", "");
text = text.replace("<22>", "");
mergeText2(y, 2, z, text, 10);
}
/**
* The function generates the narrative(1) for 5.1 SELF-EMPLOYMENT [Need to double check]
* @param {string} y - row
* @param {string} x - column
* @param {string} z - position
*/
function displayNarrativeIndicator51Employment(y, x, z) {
if (totaloutputel > 0 && totaloutputbl > 0) {
text = "Overall, the percent of beneficiaries who report currently being self-employed has <1> by <2> percentage points from <3> at baseline to <4> at endline.";
if (Math.round(table5[2][4] * 100) != 0) {
text = text + String.fromCharCode(10) + String.fromCharCode(10) +
"Of these, the percent of businesses registered by the host government <5> by <6> percentage points from <7> to <8>." + String.fromCharCode(10) + String.fromCharCode(10) +
"In terms of sustainability of employment, of those who are self employed, " + "<444>" + String.fromCharCode(10) + String.fromCharCode(10) +
"At endline, the total number of other persons employed is <9>, compared to <11> at baseline." + String.fromCharCode(10) + String.fromCharCode(10) +
"On average, for every 1 person who is employed, the number of other(s) employed by her/him <12> from <13> at baseline to <14> at endline.";
}
if (Math.round(table5[2][2] * 100) == Math.round(table5[2][4] * 100)) {
text = text.replace("<1>", "remained the same at " + Math.round(table5[2][4] * 100) + "%");
text = text.replace(" by <2> percentage points from <3> at baseline to <4> at endline", "");
}
else {
if (table5[2][4] > table5[2][2]) {
text = text.replace("<1>", "increased")
} else {
text = text.replace("<1>", "decreased")
}
text = text.replace("<2>", Math.abs(Math.round((table5[2][4] - table5[2][2]) * 100)));
text = text.replace("<3>", Math.round(table5[2][2] * 100) + "%");
text = text.replace("<4>", Math.round(table5[2][4] * 100) + "%");
}
if (Math.round(table4[2][2] * 100) == Math.round(table4[2][4] * 100)) {
text = text.replace("<5>", "remained the same at " + Math.round(table4[2][4] * 100) + "%");
text = text.replace(" by <6> percentage points from <7> to <8>", "");
}
else {
if (table4[2][4] > table4[2][2]) {
text = text.replace("<5>", "increased")
} else {
text = text.replace("<5>", "decreased")
}
text = text.replace("<6>", Math.abs(Math.round((table4[2][4] - table4[2][2]) * 100)));
text = text.replace("<7>", Math.round(table4[2][2] * 100) + "%");
text = text.replace("<8>", Math.round(table4[2][4] * 100) + "%");
}
table2 = sortTable(table2, 5);
var inc = 0;
var dc = 0;
var t1, t2, t3, t4;
for (s = 2; s < 5; s++) {
if (table2[s][5] > 0) {
if (inc == 0) {
t1 = "the percent of those employed for " + table2[s][0].toLowerCase();
t2 = "by " + Math.round(table2[s][5] * 100) + "%";
}
if (inc > 0) {
t1 = t1 + " and " + table2[s][0].toLowerCase();
t2 = t2 + " and " + Math.round(table2[s][5] * 100) + "% respectively";
}
inc++;
}
if (table2[s][5] < 0) {
if (dc == 0) {
t3 = ", while the percent of those employed for " + table2[s][0].toLowerCase();
t4 = "by " + Math.abs(Math.round(table2[s][5] * 100)) + "%";
}
if (dc > 0) {
t3 = t3 + " and " + table2[s][0].toLowerCase();
t4 = t4 + " and " + Math.abs(Math.round(table2[s][5] * 100)) + "% respectively";
}
dc++;
}
}
if (table2[2][5] != "") {
text = text.replace("<444>", t1 + " increased " + t2 + t3 + " decreased " + t4 + ".");
} else { text = text.replace("In terms of sustainability of employment, of those who are self employed, " + "<444>" + String.fromCharCode(10) + String.fromCharCode(10), ""); }
text = text.replace("<9>", table[6][3] + " individuals by " + table5[2][3] + " beneficiaries");
text = text.replace("<11>", table[6][1] + " other persons employed by " + table5[2][1] + " beneficiaries");
var self = table2[2][2];
var self2 = table2[2][4];
if (Math.round((table[6][1] / table5[2][1]) * 10) == Math.round((table[6][3] / table5[2][3]) * 10)) {
text = text.replace("<12>", "remained the same at " + String(Math.round((table[6][3] / table5[2][3]) * 10) / 10));
text = text.replace(" from <13> at baseline to <14> at endline", "");
}
else {
var baseAverageOthers = 0;
if (table5[2][1] != 0) { baseAverageOthers = table[6][1] / table5[2][1]; }
var endAverageOthers = 0;
if (table5[2][3] != 0) { var endAverageOthers = table[6][3] / table5[2][3]; }
if (baseAverageOthers < endAverageOthers) {
text = text.replace("<12>", "increased")
} else {
text = text.replace("<12>", "decreased")
}
text = text.replace("<13>", String(Math.round((baseAverageOthers) * 10) / 10));
text = text.replace("<14>", String(Math.round((endAverageOthers) * 10) / 10));
}
}
else if (totaloutputel == 0 && totaloutputbl > 0) {
text = "<1> of beneficiaries surveyed at baseline report currently being self-employed.";
if (Math.round(selfemployed * 100) != 0) {
text = text + String.fromCharCode(10) + String.fromCharCode(10) +
"Of these, <2> of businesses are registered by the host government." + String.fromCharCode(10) + String.fromCharCode(10) +
"At baseline, the majority of the self-employed beneficiaries report having worked for <3> - <4>, while the second largest number of beneficiaries report having worked for <5> - <6>." + String.fromCharCode(10) + String.fromCharCode(10) +
"Of the beneficiaries who are self-employed at baseline, <8> report they employ others and the total number of other persons employed is <9> individuals, and the largest number of employees are reported to be <11>." +
" On average, for every 1 person who is employed, s/he reports employing <12> other(s) at baseline.";
}
t1 = Math.round(selfemployed * 100) + "%";
text = text.replace("<1>", t1);
t1 = Math.round(formalemployed * 100) + "%";
text = text.replace("<2>", t1);
var t = table2[5][1];
table2[5][1] = -10;
table2 = sortTable(table2, 1);
tt1 = table2[2][0].toLowerCase();
tt2 = table2[2][2];
text = text.replace("<3>", tt1);
t1 = Math.round(tt2 * 100) + "%";
text = text.replace("<4>", t1);
if (table2[3][2] > 0) {
tt3 = table2[3][0].toLowerCase();
tt4 = table2[3][2];
text = text.replace("<5>", tt3);
t1 = Math.round(tt4 * 100) + "%";
text = text.replace("<6>", t1);
} else { text = text.replace(", while the second largest number of beneficiaries report having worked for <5> - <6>", "") }
table2[5][1] = t;
text = text.replace("<7>", totaloutput);
t1 = Math.round(employothers * 100) + "%";
text = text.replace("<8>", t1);
if (Math.round(employothers * 100) == 0) {
text = text.replace(" and the total number of other persons employed is <9> individuals, and the largest number of employees are reported to be <11>." +
" On average, for every 1 person who is employed, s/he reports employing <12> other(s) at baseline", "");
}
t1 = Math.round(totalemployed);
text = text.replace("<9>", t1);
var t = table[6][1];
table[6][1] = 0;
table = sortTable(table, 1);
t1 = table[2][0].toLowerCase();
text = text.replace("<11>", t1);
table[6][1] = t;
|
Function displayNarrativeIndicator52Income
-
displayNarrativeIndicator52Income(y, x, z)¶ The function generates the narrative(1, income) for 5.2 INCOME/SAVING GAINED FROM SELF-EMPLOYMENT [Output2]
- Arguments
y (string) – row
x (string) – column
z (string) – position
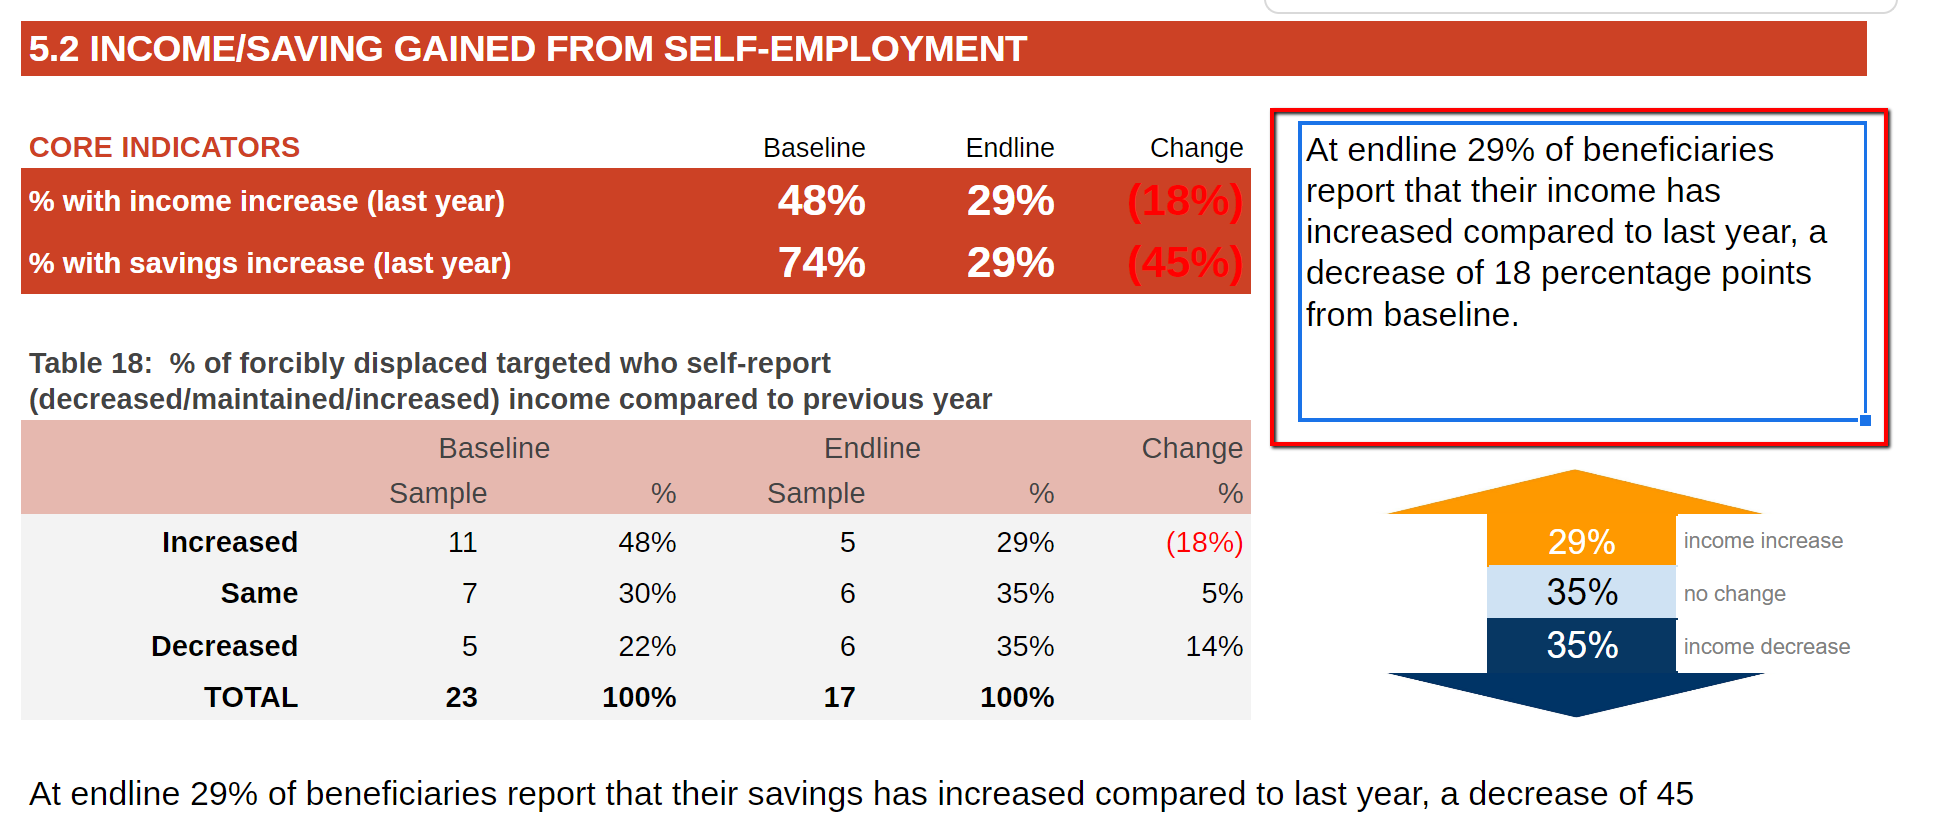
Screenshot of narrative
1 2 3 4 5 6 7 8 9 10 11 12 13 14 15 16 17 18 19 20 21 22 23 24 25 26 27 28 29 30 31 | "Of these, <2> of businesses are registered by the host government." + String.fromCharCode(10) + String.fromCharCode(10) +
"At endline, the majority of the self-employed beneficiaries report having worked for <3> - <4>, while the second largest number of beneficiaries report having worked for <5> - <6>." + String.fromCharCode(10) + String.fromCharCode(10) +
"Of the beneficiaries who are self-employed at endline, <8> report they employ others and the total number of other persons employed is <9> individuals, and the largest number of employees are reported to be <11>." +
" On average, for every 1 person who is employed, s/he reports employing <12> other(s) at endline.";
}
t1 = Math.round(table5[2][4] * 100) + "%";
text = text.replace("<1>", t1);
t1 = Math.round(table4[2][4] * 100) + "%";
text = text.replace("<2>", t1);
var t = table2[5][3];
table2[5][3] = -10;
table2 = sortTable(table2, 3);
tt1 = table2[2][0].toLowerCase();
tt2 = table2[2][4];
text = text.replace("<3>", tt1);
t1 = Math.round(tt2 * 100) + "%";
text = text.replace("<4>", t1);
if (table2[3][4] > 0) {
tt3 = table2[3][0].toLowerCase();
tt4 = table2[3][4];
text = text.replace("<5>", tt3);
t1 = Math.round(tt4 * 100) + "%";
text = text.replace("<6>", t1);
} else { text = text.replace(", while the second largest number of beneficiaries report having worked for <5> - <6>", "") }
|
Function displayNarrativeIndicator52Saving
-
displayNarrativeIndicator52Saving(y, x, z)¶ The function generates the narrative(2, saving) for 5.2 INCOME/SAVING GAINED FROM SELF-EMPLOYMENT [Output2]
- Arguments
y (string) – row
x (string) – column
z (string) – position
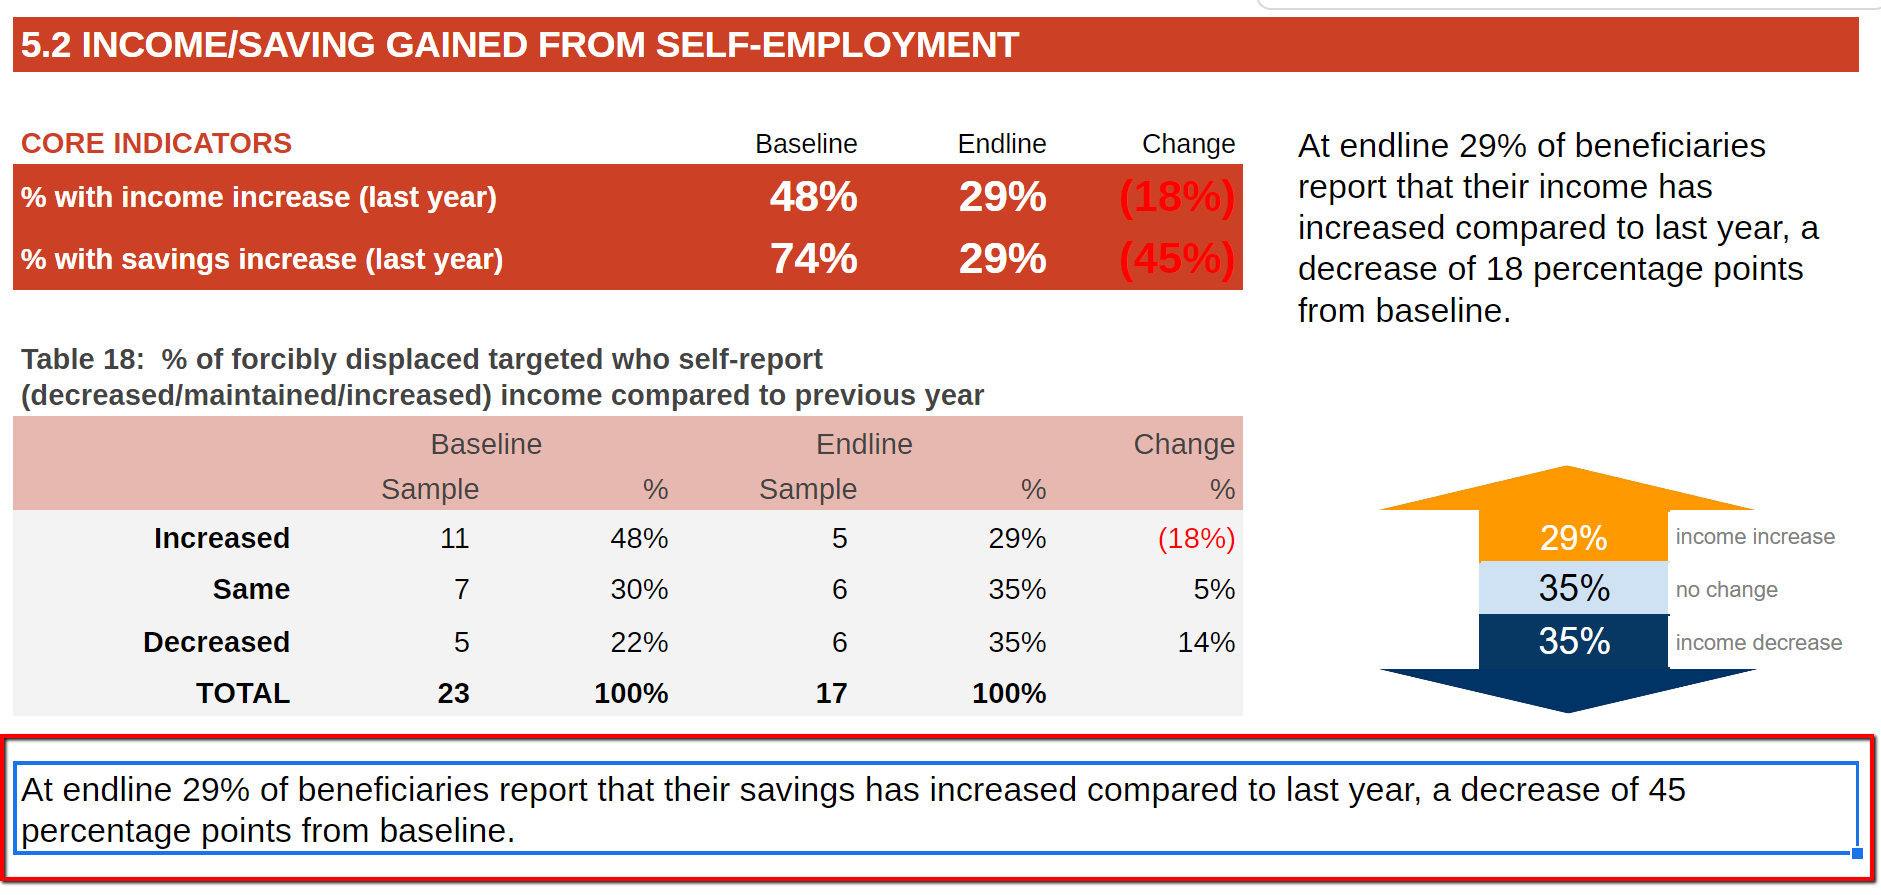
Screenshot of narrative
1 2 3 4 5 6 7 8 9 10 11 12 13 14 15 16 17 18 19 20 21 22 23 24 25 26 27 28 29 30 | }
t1 = Math.round(table[6][3]);
text = text.replace("<9>", t1);
if (table5[2][3] > 0) {
t1 = String(Math.round((table[6][3] / table5[2][3]) * 10) / 10);
} else { t1 = 0; }
text = text.replace("<12>", t1);
var t = table[6][3];
table[6][3] = 0;
table = sortTable(table, 3);
t1 = table[2][0].toLowerCase();
text = text.replace("<11>", t1);
table[6][3] = t;
}
mergeText(y, x, z, text);
}
/**
* The function generates the narrative(1, income) for 5.2 INCOME/SAVING GAINED FROM SELF-EMPLOYMENT [Output2]
* @param {string} y - row
* @param {string} x - column
* @param {string} z - position
*/
|
Function displayNarrativeIndicator61WageEmpl
-
displayNarrativeIndicator61WageEmpl(y, x, z, tn)¶ The function generates the narrative (1) for 6.1 WAGE-EMPLOYMENT [OUTPUT3]
- Arguments
y (string) – row
x (string) – column
z (string) – position
tn (string) – number of the table
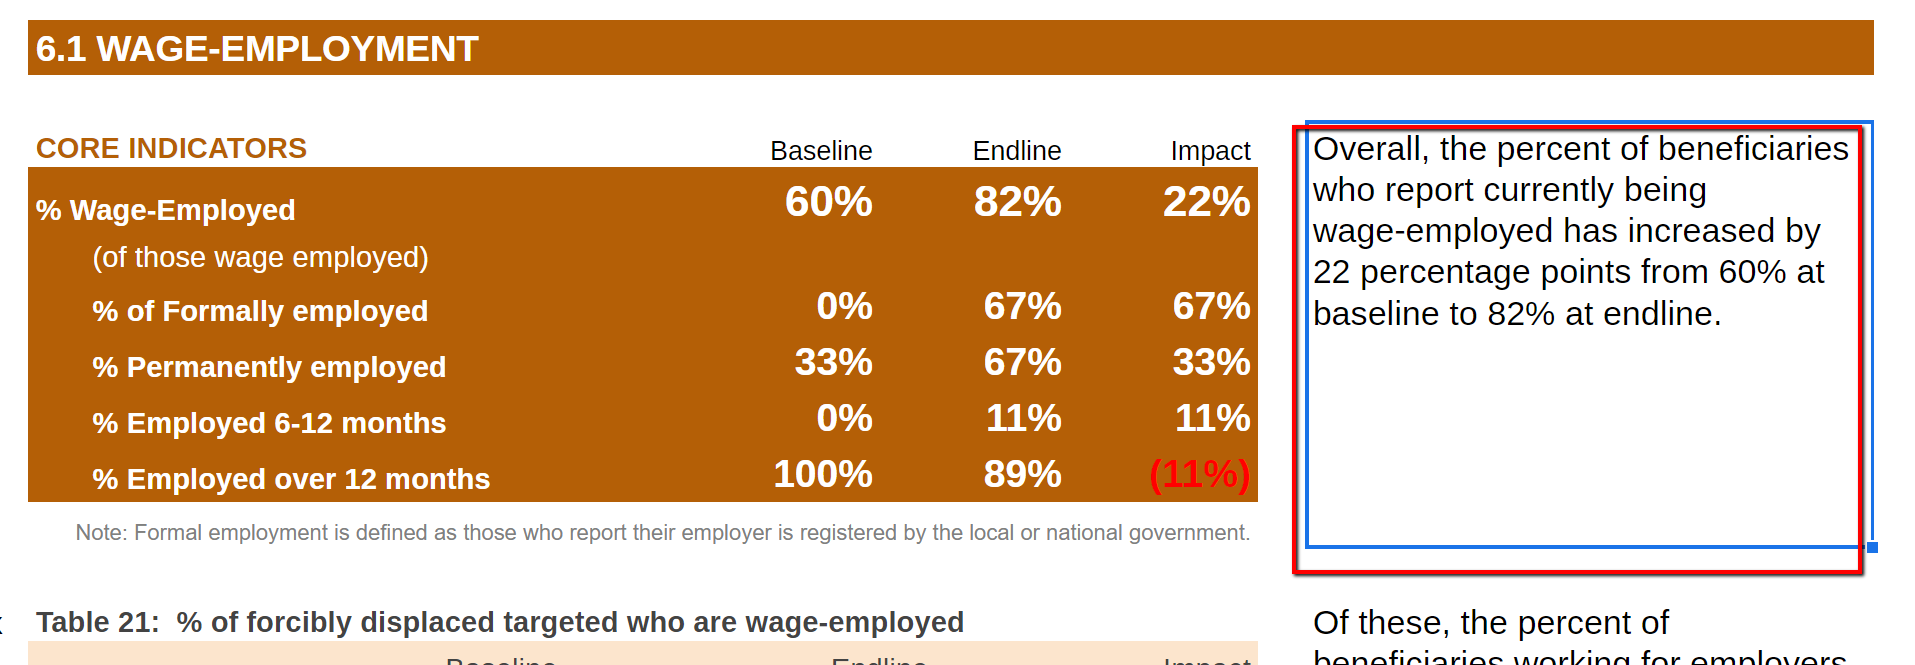
Screenshot of narrative
1 2 3 4 5 6 7 8 9 10 11 12 13 14 15 16 17 18 19 20 21 22 23 24 25 26 27 28 29 30 31 32 33 34 35 36 37 38 39 40 41 42 43 44 45 46 47 48 49 50 51 52 53 54 55 56 57 58 59 60 61 62 63 64 65 66 67 68 69 70 71 72 73 74 75 76 77 78 79 80 81 82 83 84 85 86 87 88 89 90 91 92 93 94 95 96 97 98 99 100 101 102 103 104 105 106 107 108 109 110 111 112 113 114 115 116 117 118 119 120 121 122 123 124 125 126 127 128 129 130 131 132 133 134 135 136 137 138 139 140 141 142 143 144 145 146 147 148 149 150 151 152 153 154 155 156 157 158 159 160 161 162 163 164 165 166 167 168 169 170 171 172 173 174 175 176 177 178 179 | text = text.replace("<2>", " without any change from the baseline");
}
else {
if (Math.round(table[2][4] * 100) > Math.round(table[2][2] * 100)) {
text = text.replace("<2>", ", an increase of " + Math.abs(Math.round((table[2][4] - table[2][2]) * 100)) + " percentage points from baseline")
} else {
text = text.replace("<2>", ", a decrease of " + Math.abs(Math.round((table[2][4] - table[2][2]) * 100)) + " percentage points from baseline")
}
}
}
}
else {
text = "At baseline <1> of beneficiaries report that their income has increased compared to <2>. ";
text = text.replace("<1>", Math.round(incomeyear * 100) + "%");
text = text.replace("<2>", "last year");
}
text = text.replace("<1>", "");
text = text.replace("<2>", "");
mergeText(y, x, z, text);
}
/**
* The function generates the narrative(2, saving) for 5.2 INCOME/SAVING GAINED FROM SELF-EMPLOYMENT [Output2]
* @param {string} y - row
* @param {string} x - column
* @param {string} z - position
*/
function displayNarrativeIndicator52Saving(y, x, z) {
if (totaloutputel > 0) {
text = "At endline <3> of beneficiaries report that their savings has increased compared to <4>.";
text = text.replace("<3>", Math.round(savingyear * 100) + "%");
text = text.replace("<4>", "last year<4>");
if (totaloutputbl != 0) {
if (Math.round(table2[2][2] * 100) == Math.round(table2[2][4] * 100)) {
text = text.replace("<4>", " without any change from the baseline");
}
else {
if (Math.round(table2[2][4] * 100) > Math.round(table2[2][2] * 100)) {
text = text.replace("<4>", ", an increase of " + Math.abs(Math.round((table2[2][4] - table2[2][2]) * 100)) + " percentage points from baseline")
} else {
text = text.replace("<4>", ", a decrease of " + Math.abs(Math.round((table2[2][4] - table2[2][2]) * 100)) + " percentage points from baseline")
}
}
}
}
else {
text = "At baseline <3> of beneficiaries report that their savings has increased compared to <4>.";
text = text.replace("<3>", Math.round(savingyear * 100) + "%");
text = text.replace("<4>", "last year");
}
text = text.replace("<3>", "");
text = text.replace("<4>", "");
mergeText2(y, 2, z, text, 10);
}
/**
* The function generates the narrative (1) for 6.1 WAGE-EMPLOYMENT [OUTPUT3]
* @param {string} y - row
* @param {string} x - column
* @param {string} z - position
* @param {string} tn - number of the table
*/
function displayNarrativeIndicator61WageEmpl(y, x, z) {
if (totaloutputel > 0 && totaloutputbl > 0) {
text = "Overall, the percent of beneficiaries who report currently being wage-employed has <1> by <2> percentage points from <3> at baseline to <4> at endline.";
if (Math.round(table[2][4] * 100) != 0) {
text = text + String.fromCharCode(10) + String.fromCharCode(10) +
"Of these, the percent of beneficiaries working for employers registered by the host government <5> by <6> percentage points from <7> at baseline to <8> at endline, and the percent of those employed on permanent basis <9> by <10> from <11> to <12>." + String.fromCharCode(10) + String.fromCharCode(10) +
"In terms of sustainability of employment, of those who are self employed, " + "<444>";
}
if (Math.round(table[2][2] * 100) == Math.round(table[2][4] * 100)) {
text = text.replace("<1>", "remained the same at " + Math.round(table[2][2] * 100) + "%");
text = text.replace(" by <2> percentage points from <3> at baseline to <4> at endline", "");
}
else {
if (table[2][4] > table[2][2]) {
text = text.replace("<1>", "increased")
} else {
text = text.replace("<1>", "decreased")
}
text = text.replace("<2>", Math.abs(Math.round((table[2][4] - table[2][2]) * 100)));
text = text.replace("<3>", Math.round(table[2][2] * 100) + "%");
text = text.replace("<4>", Math.round(table[2][4] * 100) + "%");
}
if (Math.round(table2[2][2] * 100) == Math.round(table2[2][4] * 100)) {
text = text.replace("<5>", "remained the same at " + Math.round(table2[2][2] * 100) + "%");
text = text.replace(" by <6> percentage points from <7> at baseline to <8> at endline", "");
}
else {
if (table2[2][4] > table2[2][2]) {
text = text.replace("<5>", "increased")
} else {
text = text.replace("<5>", "decreased")
}
text = text.replace("<6>", Math.abs(Math.round((table2[2][4] - table2[2][2]) * 100)));
text = text.replace("<7>", Math.round(table2[2][2] * 100) + "%");
text = text.replace("<8>", Math.round(table2[2][4] * 100) + "%");
}
if (Math.round(table3[2][2] * 100) == Math.round(table3[2][4] * 100)) {
text = text.replace("<9>", "remained the same at " + Math.round(table3[2][2] * 100) + "%");
text = text.replace(" by <10> from <11> to <12>", "");
}
else {
if (table3[2][4] > table3[2][2]) {
text = text.replace("<9>", "increased")
} else {
text = text.replace("<9>", "decreased")
}
text = text.replace("<10>", Math.abs(Math.round((table3[2][4] - table3[2][2]) * 100)));
text = text.replace("<11>", Math.round(table3[2][2] * 100) + "%");
text = text.replace("<12>", Math.round(table3[2][4] * 100) + "%");
}
table4 = sortTable(table4, 5);
var inc = 0;
var dc = 0;
var t1, t2, t3, t4;
for (s = 2; s < 5; s++) {
if (table4[s][5] > 0) {
if (inc == 0) {
t1 = "the percent of those employed for " + table4[s][0].toLowerCase();
t2 = "by " + Math.round(table4[s][5] * 100) + "%";
}
if (inc > 0) {
t1 = t1 + " and " + table4[s][0].toLowerCase();
t2 = t2 + " and " + Math.round(table4[s][5] * 100) + "% respectively";
}
inc++;
}
if (table2[s][5] < 0) {
if (dc == 0) {
t3 = ", while the percent of those employed for " + table2[s][0].toLowerCase();
t4 = "by " + Math.abs(Math.round(table2[s][5] * 100)) + "%";
}
if (dc > 0) {
t3 = t3 + " and " + table2[s][0].toLowerCase();
t4 = t4 + " and " + Math.abs(Math.round(table2[s][5] * 100)) + "% respectively";
}
dc++;
}
}
if (table4[2][5] != "") {
text = text.replace("<444>", t1 + " increased " + t2 + t3 + " decreased " + t4 + ".");
} else { text = text.replace("In terms of sustainability of employment, of those who are self employed, " + "<444>", ""); }
}
else if (totaloutputel == 0 && totaloutputbl > 0) {
text = "<1> of beneficiaries surveyed at baseline report currently being wage-employed.";
if (Math.round(selfemployed * 100) != 0) {
text = text + String.fromCharCode(10) + String.fromCharCode(10) +
"Of these, <2> are employed by employers registered by the host government, and <7> are employed on a permanent basis." + String.fromCharCode(10) + String.fromCharCode(10) +
"The majority of the wage-employed beneficiaries report having worked for <3> - <4>, while the second largest number of beneficiaries report having worked for <5> - <6>.";
}
t1 = Math.round(selfemployed * 100) + "%";
text = text.replace("<1>", t1);
|
Function displayNarrativeIndicator3
-
displayNarrativeIndicator3(y, x, z, tn)¶ The function generates the 2nd narrative for 3.Sample size per output
- Arguments
y (string) – row
x (string) – column
z (string) – position
tn (string) – number of the table

Screenshot of narrative
1 2 3 4 5 6 7 8 9 10 | tt2 = table4[2][2];
text = text.replace("<3>", tt1);
t1 = Math.round(tt2 * 100) + "%";
text = text.replace("<4>", t1);
if (table4[3][2] > 0) {
tt3 = table4[3][0].toLowerCase();
tt4 = table4[3][2];
|
Function displayNarrativeIndicator4OutputTable1
-
displayNarrativeIndicator4OutputTable1(y, x, z, tn)¶ The function generates the narrative for 4.4. OUTPUT 1: ACCESS TO AGRICULTURE PRODUCTION ENHANCED >Output1
- Arguments
y (string) – row
x (string) – column
z (string) – position
tn (string) – number of the table
1 2 3 4 5 6 7 8 9 10 | text = text.replace("<7>", t1);
}
else if (totaloutputel > 0 && totaloutputbl == 0) {
text = "<1> of beneficiaries surveyed at endline report currently being wage-employed.";
if (Math.round(table[2][4] * 100) != 0) {
text = text + String.fromCharCode(10) + String.fromCharCode(10) +
"Of these, <2> are employed by employers registered by the host government, and <7> are employed on a permanent basis." + String.fromCharCode(10) + String.fromCharCode(10) +
"The majority of the wage-employed beneficiaries report having worked for <3> - <4>, while the second largest number of beneficiaries report having worked for <5> - <6>.";
}
|
Function displayNarrativeIndicator4OutputTable2
-
displayNarrativeIndicator4OutputTable2(y, x, z, tn)¶ The function generates the narrative for 4.OUTPUT 1: ACCESS TO AGRICULTURE PRODUCTION ENHANCED >Output1 >Table2
- Arguments
y (string) – row
x (string) – column
z (string) – position
tn (string) – number of the table

Screenshot of narrative
1 2 3 4 5 6 7 8 9 10 11 12 13 14 15 16 17 18 19 20 21 22 23 24 25 26 27 28 29 30 31 32 33 34 35 36 37 38 39 40 41 42 43 44 45 46 47 48 49 50 51 52 53 54 55 56 57 58 59 60 61 62 63 64 65 66 67 68 69 70 71 72 73 74 75 76 77 78 79 80 81 82 83 84 85 86 87 88 89 | text = text.replace("<7>", t1);
var t = table4[5][3];
table4[5][3] = -10;
table4 = sortTable(table4, 3);
tt1 = table4[2][0].toLowerCase();
tt2 = table4[2][4];
text = text.replace("<3>", tt1);
t1 = Math.round(tt2 * 100) + "%";
text = text.replace("<4>", t1);
if (table4[3][4] > 0) {
tt3 = table4[3][0].toLowerCase();
tt4 = table4[3][4];
text = text.replace("<5>", tt3);
t1 = Math.round(tt4 * 100) + "%";
text = text.replace("<6>", t1);
} else { text = text.replace(", while the second largest number of beneficiaries report having worked for <5> - <6>", ""); }
table4[5][3] = t;
t1 = Math.round(permanentemployed * 100) + "%";
text = text.replace("<7>", t1);
}
mergeText(y, x, z, text);
}
/**
* The function generates the 2nd narrative for 3.Sample size per output
* @param {string} y - row
* @param {string} x - column
* @param {string} z - position
* @param {string} tn - number of the table
*/
function displayNarrativeIndicator3(y, x, z, tn) {
text = "The UNHCR Livelihoods indicators are based on DFID's Sustainable Livelihoods Framework centered on the belief that people require a range of assets to achieve positive livelihood outcomes.";
sumsheet.getRange(y, x).setValue(text);
rng = sumsheet.getRange(y, x, 1, 6);
rng.merge();
rng.setWrap(true);
rng.setHorizontalAlignment("left");
rng.setVerticalAlignment("top");
rng.setFontSize(14);
}
/**
* The function generates the narrative for 4.4. OUTPUT 1: ACCESS TO AGRICULTURE PRODUCTION ENHANCED >Output1
* @param {string} y - row
* @param {string} x - column
* @param {string} z - position
* @param {string} tn - number of the table
*/
function displayNarrativeIndicator4OutputTable1(y, x, z, tn) {
text = "The three main types of agriculture programs implemented by UNHCR and partners include farming/ crop cultivation, fisheries, and livestock. Beneficiaries may be engaged in more than one agriculture activity at the same time."
sumsheet.getRange(y, x).setValue(text);
rng = sumsheet.getRange(y, x, 1, 10);
rng.merge();
rng.setWrap(true);
rng.setHorizontalAlignment("left");
rng.setVerticalAlignment("top");
rng.setFontSize(14);
}
/**
* The function generates the narrative for 4.OUTPUT 1: ACCESS TO AGRICULTURE PRODUCTION ENHANCED >Output1 >Table2
* @param {string} y - row
* @param {string} x - column
* @param {string} z - position
* @param {string} tn - number of the table
*/
function displayNarrativeIndicator4OutputTable2(y, x, z, tn) {
text = "The majority of the beneficiaries surveyed working in agriculture are engaged in <1><2>" +
String.fromCharCode(10) + String.fromCharCode(10) + "Table <11> displays the number of beneficiaries sampled who benefited from the different program interventions. In some instances, a beneficiary can benefit from more than one type of intervention support."
text = text.replace("<11>", tn);
var t = table[table.length - 1][1];
table[table.length - 1][1] = 0;
table = sortTable(table, 1);
if (totaloutputel > 0 && totaloutputbl > 0) {
var r1 = table[2][4]*1000 / 10;
var r2 = Math.round(r1);
var r3 = String(r2).replace(/(\d)(?=(\d{3})+(?!\d))/g, '$1,');
var msgend = " and " + r3 + "% at endline"
} else { var msgend = ""; }
if (totaloutputbl > 0) {
var r1 = table[2][2]*1000 / 10;
|
Function displayNarrativeIndicator56Interventions
-
displayNarrativeIndicator56Interventions(y, x, z, tn)¶ The function generates the narrative (1) for 5. OUTPUT 2: ACCESS TO SELF-EMPLOYMENT FACILITATED; 6. OUTPUT 3: ACCESS TO WAGE-EMPLOYMENT
- Arguments
y (string) – row
x (string) – column
z (string) – position
tn (string) – number of the table
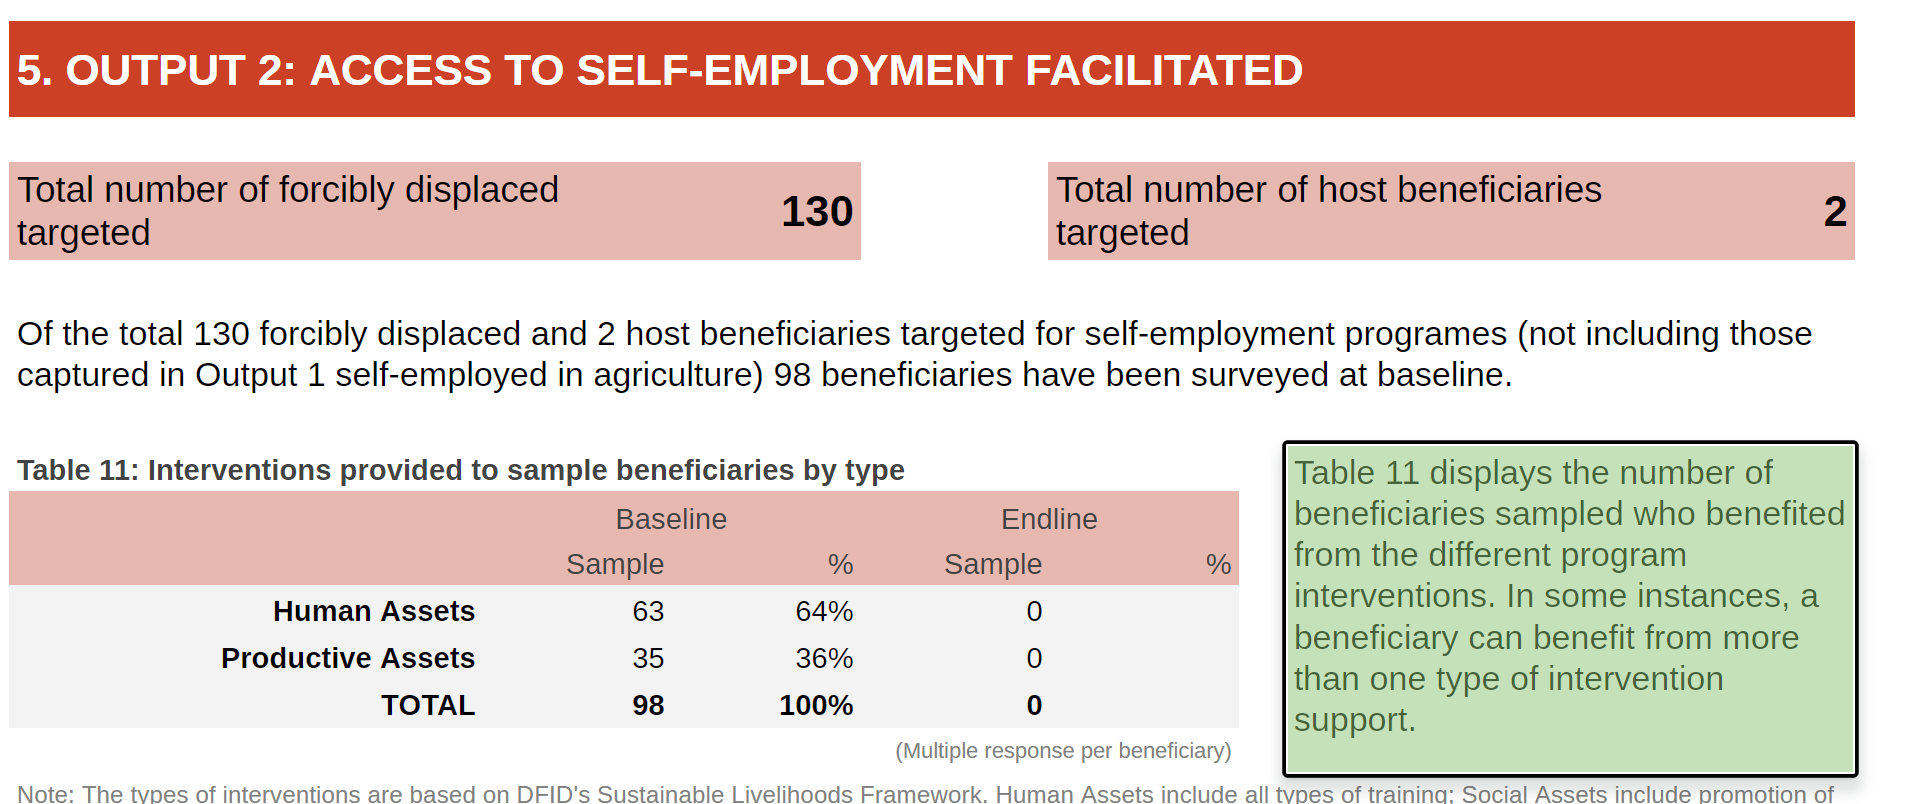
Screenshot of narrative
1 2 3 4 | var r3 = String(r2).replace(/(\d)(?=(\d{3})+(?!\d))/g, '$1,');
t1 = table[2][0].toLowerCase() + " (" + r3 + "% at endline)";
}
|
Function sortTable
-
sortTable(x, c)¶ The function sorts the table
- Arguments
x (string) – column
c (string) – position
1 2 3 4 5 6 7 8 9 10 11 12 13 14 15 16 17 | if (totaloutputel > 0 && totaloutputbl > 0) {
var r1 = table[3][4]*1000 / 10;
var r2 = Math.round(r1);
var r3 = String(r2).replace(/(\d)(?=(\d{3})+(?!\d))/g, '$1,');
var msgend = " (" + r3 + "% at endline)"
} else { var msgend = ""; }
if (totaloutputbl > 0) {
var rr1 = table[3][2]*1000 / 10;
var rr2 = Math.round(rr1);
var rr3 = String(rr2).replace(/(\d)(?=(\d{3})+(?!\d))/g, '$1,');
t1 = ", while ";
t1 = t1 + rr2 + "% are engaged in " + table[3][0].toLowerCase() + " at baseline" + msgend;
}
else if (totaloutputel > 0) {
table = sortTable(table, 3);
var r1 = table[3][4]*1000 / 10;
|
Function displayNarrative3SampleSize
-
displayNarrative3SampleSize(y, x, z)¶ The function generates the narrative for 3.Sample size per output
- Arguments
y (string) – row
x (string) – column
z (string) – position

Screenshot of narrative
1 2 3 4 5 6 7 8 9 10 11 12 13 14 15 16 17 18 19 20 21 22 23 24 | if (table[4][0] != "TOTAL") {
if (totaloutputel > 0 && totaloutputbl > 0) {
var r1 = table[4][4]*1000 / 10;
var r2 = Math.round(r1);
var r3 = String(r2).replace(/(\d)(?=(\d{3})+(?!\d))/g, '$1,');
var msgend = " (" + r3 + "% at endline)"
} else { var msgend = ""; }
if (totaloutputbl > 0) {
var rrr1 = table[4][2]*1000 / 10;
var rrr2 = Math.round(rrr1);
var rrr3 = String(rrr2).replace(/(\d)(?=(\d{3})+(?!\d))/g, '$1,');
t1 = t1 + " and " + rrr2 + "% are engaged in " + table[4][0].toLowerCase() + " at baseline" + msgend;
}
else if (totaloutputel > 0) {
table = sortTable(table, 3);
var r1 = table[4][4]*1000 / 10;
var r2 = Math.round(r1);
var r3 = String(r2).replace(/(\d)(?=(\d{3})+(?!\d))/g, '$1,');
t1 = t1 + " and " + rr2 + "% are engaged in " + table[4][0].toLowerCase() + " at endline";
}
}
}
t1 = t1 + ".";
|
Function mergeText
-
mergeText(y, x, z, text, xx)¶ The function merges the cells and adds the format
- Arguments
y (string) – row, the starting row index of the range
x (string) – column, the starting column index of the range;
z (string) – the variable is not used
text (string) – text
xx (string) – The number of columns to return
1 2 3 4 5 6 7 8 9 10 11 | * @param {string} x - column
* @param {string} z - position
* @param {string} tn - number of the table
*/
function displayNarrativeIndicator56Interventions(y, x, z, tn) {
text = "Table <11> displays the number of beneficiaries sampled who benefited from the different program interventions. In some instances, a beneficiary can benefit from more than one type of intervention support."
text = text.replace("<11>", tn);
mergeText(y, x, z, text);
}
/**
|
Function mergeText2
-
mergeText2(y, x, z, text, xx)¶ The function merges the cells and adds the format to narrative331a, 331b, narrative11b
- Arguments
y (string) – row, the starting row index of the range
x (string) – column, the starting column index of the range;
z (string) – the variable is not used
text (string) – text
xx (string) – The number of columns to return
1 2 3 4 5 6 7 8 9 10 11 | }
}
return result;
}
/**
* The function counts number of items
* @param {array} item - jsonData
* @param {string} header - list of headers
*/
|
Function convertNumberToText
-
convertNumberToText(x)¶ The function converts number to text
- Arguments
x (integer) – number
1 2 3 4 5 6 7 8 9 10 11 12 13 14 15 16 17 18 19 20 21 22 23 24 25 26 27 28 29 30 31 |
function displayNarrative3SampleSize(y, x, z) {
text = "In <1> there <2> - <3> - and they provide programs in the following areas: <4>";
if (Country == "ALL") {
t1 = "all the countries,"
} else {
t1 = Country.replace("_", " ");
};
text = text.replace("<1>", t1);
var xx = takeUniqueDataBGsheet(3, "0");
if (xx == 1) {
t1 = "is one implementing partner surveyed"
} else {
t1 = "are " + convertNumberToText(xx) + " implementing partners surveyed"
};
text = text.replace("<2>", t1);
text = text.replace("<3>", partner);
text = text.replace("<4>", output);
mergeText(y, x, z, text);
}
/**
* The function merges the cells and adds the format
* @param {string} y - row, the starting row index of the range
* @param {string} x - column, the starting column index of the range;
* @param {string} z - the variable is not used
* @param {string} text - text
|
Function countTotalNumIndicator2Dependency
-
countTotalNumIndicator2Dependency(item, header, line, min, max)¶ The function applies the filters and counts the total number for each category [2. PROFILE OF SAMPLE BENEFICIARIES AT BASELINE and 2. PROFILE OF SAMPLE BENEFICIARIES AT ENDLINE ]
- Arguments
item (array) – jsonData
header (string) – column header
line (string) – baseline/endline/midline
min (number) – min value
max (number) – max value

Screenshot of % with Dependency Ratio >2.0
1 2 3 4 5 6 7 8 9 10 11 12 13 | rng.setFontSize(14);
}
/**
* The function merges the cells and adds the format to narrative331a, 331b, narrative11b
* @param {string} y - row, the starting row index of the range
* @param {string} x - column, the starting column index of the range;
* @param {string} z - the variable is not used
* @param {string} text - text
* @param {string} xx - The number of columns to return
*/
function mergeText2(y, x, z, text, xx) {
sumsheet.getRange(y, x).setValue(text);
rng = sumsheet.getRange(y, x, 1, xx);
|
Function countTotalNumCategoryIndicator2Agr
-
countTotalNumCategoryIndicator2Agr(item, header, category, line, contain)¶ The function counts the total number for each category [4.2 AGRICULTURAL PRODUCTIVITY - > Table. Total number of animal owned by the self-employed beneficiaries]
- Arguments
item (array) – jsonData
header (string) – list of header
category (string) – type of category
line (string) – Baseline/Endline
contain (string) – [0,1]
1 2 3 4 5 6 7 8 9 10 11 12 13 14 15 16 17 18 19 20 21 22 23 24 25 26 27 28 29 30 31 32 33 34 35 36 37 38 | /**
* The function converts number to text
* @param {integer} x - number
*/
function convertNumberToText(x) {
var result = "";
if (x == 2) {
result = "two";
}
if (x == 3) {
result = "three";
}
if (x == 4) {
result = "four";
}
if (x == 5) {
result = "five";
}
if (x == 6) {
result = "six";
}
if (x == 7) {
result = "seven";
}
if (x == 8) {
result = "eight";
}
if (x == 9) {
result = "nice";
}
if (x == 10) {
result = "ten";
}
return result;
}
}
/* COMMON COMPONENTS ***************/
|
Function countTotalNumAgeGroup
-
countTotalNumAgeGroup(item, header, min, max, line, contain)¶ The function counts the total number for age groups [2. PROFILE OF SAMPLE BENEFICIARIES AT BASELINE and 2. PROFILE OF SAMPLE BENEFICIARIES AT ENDLINE ]
- Arguments
item (array) – jsonData
header (string) – list of header
min (number) – min value
max (number) – max value
line (string) – Baseline/Endline
contain (string) – [0,1]

Screenshot
1 2 3 4 5 6 7 8 9 10 11 12 13 14 15 16 17 18 19 20 21 22 23 24 25 26 27 28 29 30 31 32 33 34 35 36 37 38 39 40 41 42 43 44 45 46 47 48 49 | if (x == 4) {
result = "four";
}
if (x == 5) {
result = "five";
}
if (x == 6) {
result = "six";
}
if (x == 7) {
result = "seven";
}
if (x == 8) {
result = "eight";
}
if (x == 9) {
result = "nice";
}
if (x == 10) {
result = "ten";
}
return result;
}
}
/* COMMON COMPONENTS ***************/
{
/**
* The function applies the filters and counts the total number for each category [2. PROFILE OF SAMPLE BENEFICIARIES AT BASELINE and 2. PROFILE OF SAMPLE BENEFICIARIES AT ENDLINE ]
* @param {array} item - jsonData
* @param {string} header - column header
* @param {string} line - baseline/endline/midline
* @param {number} min - min value
* @param {number} max - max value
*/
function countTotalNumIndicator2Dependency(item, header, line, min, max) {
var y = 0;
var count = 0;
for (i = 0; i < item.length; i++) {
if (filterMain(i, item, Country, Partner, Camp, Status, Year, Gender, Age, line, '0', '0') != 9) {
continue;
}
y++;
if (item[i][header] > min && item[i][header] < max) {
count++;
}
}
return count / y;
}
|
Function countNumBenefIndicator
-
countNumBenefIndicator(taskname, item, header, category, line, contain, ACI, AC2)¶ The function counts number of beneficiary per indicators [3. SAMPLE SIZE PER OUTPUT > Table: Number of beneficiaries per livelihoods output surveyed]
- Arguments
taskname (string) – name of the task
item (array) – jsonData
header (string) – list of headers
category (type) – type of category
line (type) – Baseline/Endline
contain (type) – [0,1]
ACI (type) –
AC2 (type) –

Screenshot
1 2 3 4 5 6 7 8 9 10 11 12 13 14 15 16 17 18 19 20 21 22 23 24 25 26 27 28 29 30 31 32 33 34 35 36 37 38 39 40 41 42 43 44 45 | for (i = 0; i < item.length; i++) {
if (filterMain(i, item, Country, Partner, Camp, Status, Year, Gender, Age, line, '0', '0') != 9) {
continue;
}
if (item[i]["PARTNER_INFO/Output2"] == "0") { continue; }
for (ii = 0; ii < category.length; ii++) {
if (category[ii] == "Total" && item[i][header] != "") {
count++;
continue;
}
if (contain == 0) {
if (item[i][header] != "" && String(item[i][header]) == category[ii]) {
count++;
continue;
}
}
if (contain == 1) {
if (item[i][header] != "" && String(item[i][header]).indexOf(category[ii]) > -1) {
count++;
continue;
}
}
if (item[i][header] == "0" && category[ii] == "Other") {
count++;
continue;
}
}
if (count > 0) {
result++;
count = 0;
} else {
count = 0;
}
}
return result;
}
/**
* The function counts the total number for age groups [2. PROFILE OF SAMPLE BENEFICIARIES AT BASELINE and 2. PROFILE OF SAMPLE BENEFICIARIES AT ENDLINE ]
* @param {array} item - jsonData
* @param {string} header - list of header
* @param {number} min - min value
* @param {number} max - max value
* @param {string} line - Baseline/Endline
|
Function countNumItemsIndicator42Agr
-
countNumItemsIndicator42Agr(item, header, line, cc, ACI, AC2)¶ The function counts number of items for table [4.2 AGRICULTURAL PRODUCTIVITY]
- Arguments
item (array) – jsonData
header (string) – list of headers
line (type) – Baseline/Endline
cc (type) –
ACI (type) –
AC2 (type) –
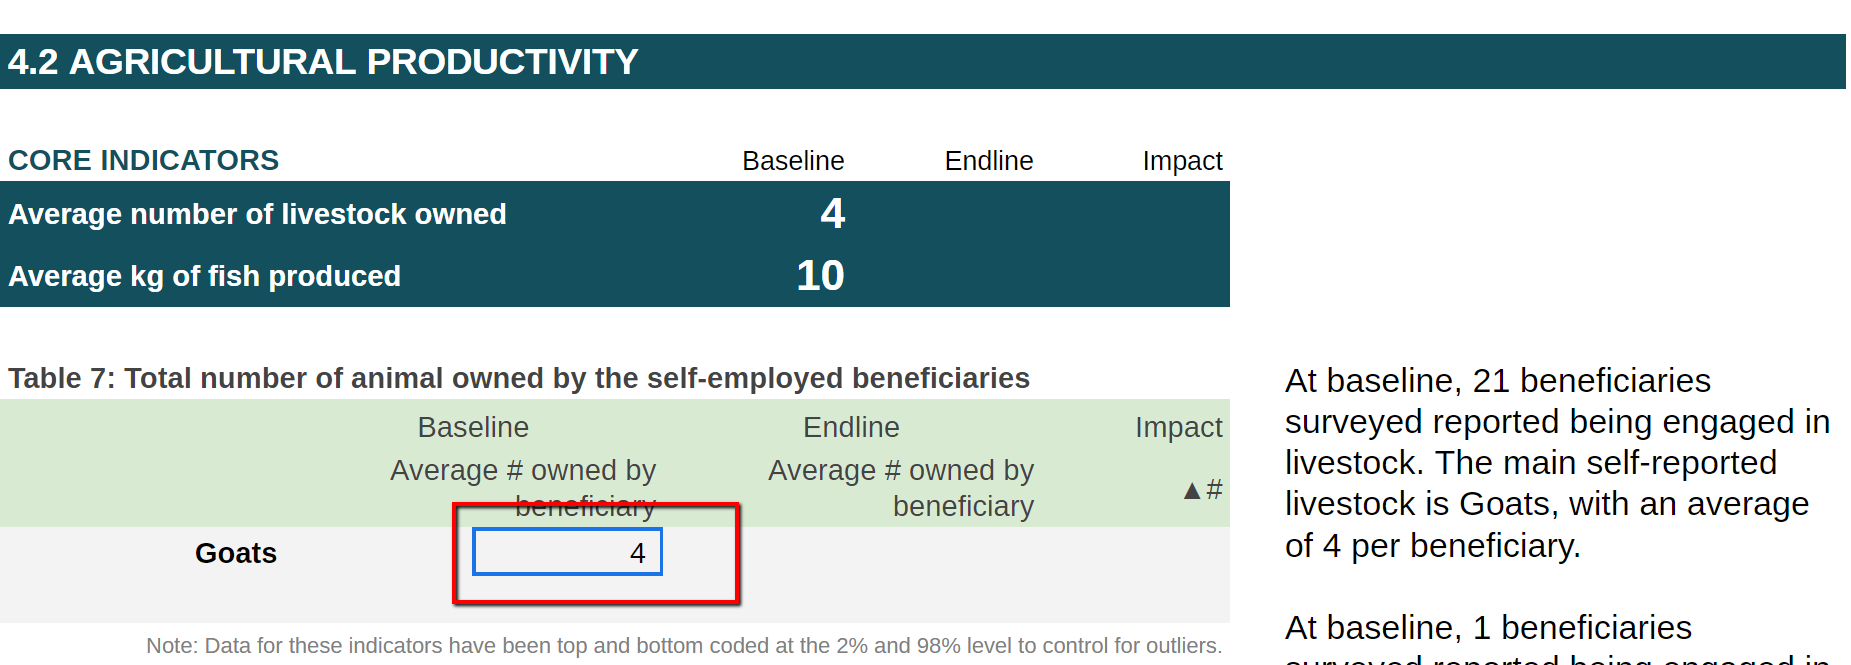
Screenshot
1 2 3 4 5 6 7 8 9 10 11 12 13 14 15 16 17 18 | if (item[i][header] > max || item[i][header] < min) { result++; }
}
return result;
}
/**
* The function counts number of beneficiary per indicators [3. SAMPLE SIZE PER OUTPUT > Table: Number of beneficiaries per livelihoods output surveyed]
* @param {string} taskname - name of the task
* @param {array} item - jsonData
* @param {string} header - list of headers
* @param {type} category - type of category
* @param {type} line - Baseline/Endline
* @param {type} contain [0,1]
* @param {type} ACI
* @param {type} AC2
*/
|
Function countNumItemsPartnerData
-
countNumItemsPartnerData(item, header)¶ The function counts number of items
- Arguments
item (array) – jsonData
header (string) – list of headers
1 2 3 4 5 6 7 8 9 10 11 | //0705
if (header == "G_OUTPUT1/O1_Agricultural_Employment/O1_Employment_Others" || header.indexOf("Others_No") > -1) { if (item[i]["G_OUTPUT1/O1_Agricultural_Employment/O1_Employment_Sustainability"].indexOf("Self") == -1) { continue; } }
//0705
for (ii = 0; ii < category.length; ii++) {
//Browser.msgBox(category[ii]);
if (category[ii] == "Total" && item[i][header] != "") {
count++;
continue;
}
|
Function countNumAnimalsIndicator4
-
countNumAnimalsIndicator4(item, header, category, number, line, contain)¶ The function counts the average number of animals owned by beneficiary [4.2 AGRICULTURAL PRODUCTIVITY >Table Total number of animal owned by the self-employed beneficiaries]
- Arguments
item (array) – json data
header (array) – list of headers
category (array) – name of the category
number (array) –
line (array) – Baseline/Endline
contain (array) –
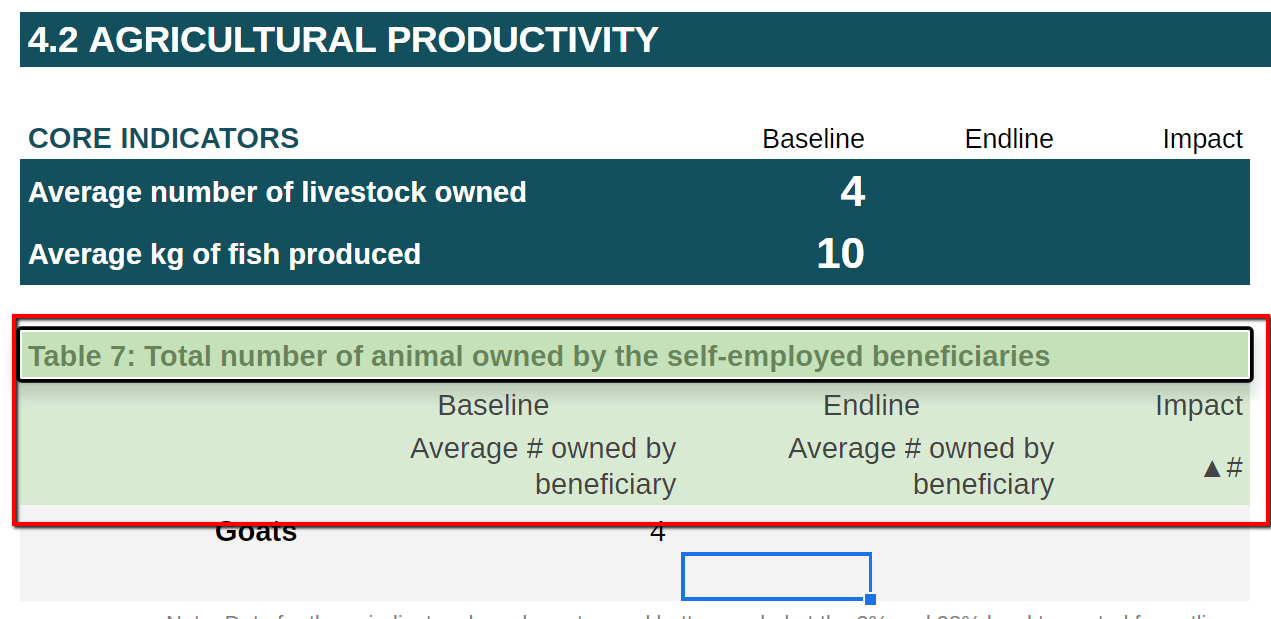
Screenshot
1 2 3 4 5 6 7 8 9 10 11 12 13 14 15 16 17 18 19 | continue;
}
}
if (count > 0) {
result++;
count = 0;
} else {
count = 0;
}
}
return result;
}
/**
* The function counts number of items for table [4.2 AGRICULTURAL PRODUCTIVITY]
* @param {array} item - jsonData
* @param {string} header - list of headers
* @param {type} line - Baseline/Endline
* @param {type} cc
|
Function initialFilter
-
initialFilter()¶ The function returns the initial states for the filters
1 2 3 4 5 6 7 8 | }
}
return result;
}
/**
* The function counts number of items
|
Function filterpage
-
filterpage()¶ The function takes the filter. It is used in Generate4()
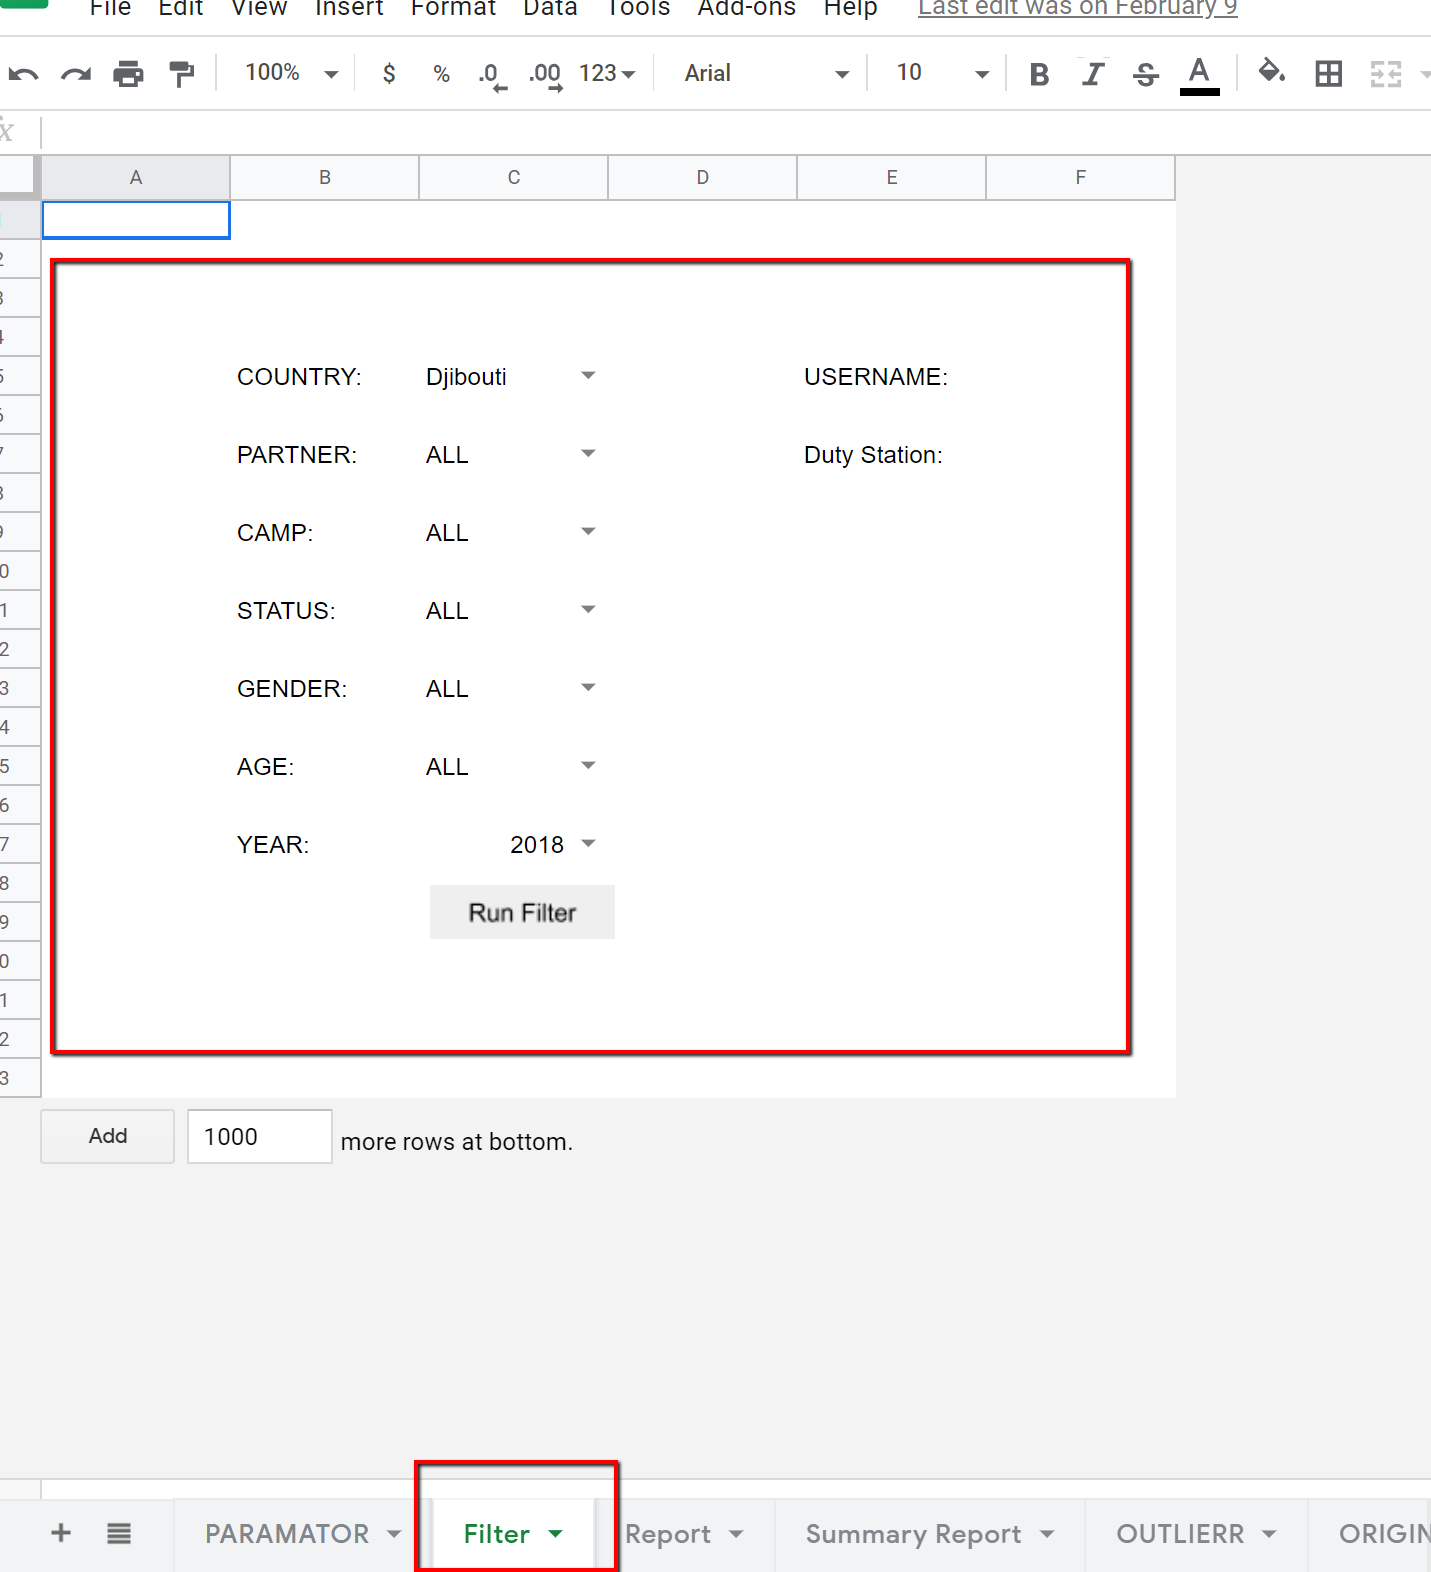
Screenshot of filter page
1 2 3 4 5 6 7 8 9 10 11 12 13 14 15 16 17 18 19 20 21 22 23 24 25 26 27 28 29 30 31 32 33 34 35 36 37 38 39 40 41 42 43 44 45 46 47 | function countNumItemsPartnerData(item, header) {
var result = 0;
var count = 0;
var c1 = item[0].indexOf(header);
for (ix = 1; ix < item.length; ix++) {
if (item[ix][c1] != "") {
result = result + parseFloat(item[ix][c1]);
}
}
return result;
}
/**
* The function counts the average number of animals owned by beneficiary [4.2 AGRICULTURAL PRODUCTIVITY >Table Total number of animal owned by the self-employed beneficiaries]
*
* @param {array} item - json data
* @param {array} header - list of headers
* @param {array} category - name of the category
* @param {array} number
* @param {array} line - Baseline/Endline
* @param {array} contain
*/
function countNumAnimalsIndicator4(item, header, category, number, line, contain) {
var result = 0;
for (i = 0; i < item.length; i++) {
if (filterMain(i, item, Country, Partner, Camp, Status, Year, Gender, Age, line, '0', '0') != 9) {
continue;
}
if (contain == 0 && item[i][header] != category) {
continue;
}
if (contain == 1 && String(item[i][header]).indexOf(category) == -1) {
continue;
}
var UNIT = 1;
if (item[i][header] != "") {
result = result + item[i][number] * UNIT;
}
}
return result;
}
}
{ /*Filter*/
|
Function filterBenefAge
-
filterBenefAge(ops, y, x, item, header)¶ The function returns the filter options for the header “BENEFICIARY_INFO/Age”
1 2 3 4 5 6 7 8 9 10 11 12 13 14 15 16 17 18 19 20 21 22 23 24 25 26 27 28 29 30 31 32 33 34 35 36 37 38 39 40 41 42 43 44 45 46 47 48 49 50 51 52 53 54 55 56 57 58 59 60 61 62 | var Status;// = filtersheet.getRange(11, 3).getValue();
var Gender;// = filtersheet.getRange(13, 3).getValue();
var Age;// = filtersheet.getRange(15, 3).getValue();
var Year;// = filtersheet.getRange(17, 3).getValue();
var PROBLEMSTATEMENT;
/**
* The function returns the initial states for the filters
*/
function initialFilter() {
for (i = 0; i < jsonData.length; i++) {
if (filterInitial(i, jsonData, Country, Partner, Camp, Status, Year, Gender, Age, "ALL", "0", "0") != 9) {
continue;
}
jsonData[i]['FILTER'] = "1";
}
}
/**
* The function takes the filter. It is used in Generate4()
*/
function filterpage() {
/*idx {string } - year*/
var idx = key["idx"];
var sst = SpreadsheetApp.openById(idx);
var filtersheet = sst.getSheetByName("Filter");
Country = filtersheet.getRange(5, 3).getValue();
User = filtersheet.getRange(5, 6).getValue();
Dstation = filtersheet.getRange(7, 6).getValue();
Partner = filtersheet.getRange(7, 3).getValue();
Camp = filtersheet.getRange(9, 3).getValue();
Status = filtersheet.getRange(11, 3).getValue();
Gender = filtersheet.getRange(13, 3).getValue();
Age = filtersheet.getRange(15, 3).getValue();
Year = filtersheet.getRange(17, 3).getValue();
var jsonDataall = convertSheet2Json(Country);
jsonData = jsonDataall.filter(function (value) {
return (value["Country"] == Country);
});
initialFilter()
filterBenefAge("Initial", 5, 3, jsonData, 'Country');
filterBenefAge("Initial", 7, 3, jsonData, "PARTNER_INFO/PARTNER");
filterBenefAge("Initial", 9, 3, jsonData, "PARTNER_INFO/Camp");
filterBenefAge("Initial", 11, 3, jsonData, "BENEFICIARY_INFO/Status");
filterBenefAge("Initial", 13, 3, jsonData, "BENEFICIARY_INFO/Gender");
filterBenefAge("Initial", 15, 3, jsonData, "BENEFICIARY_INFO/Age");
|
Function BackGround
-
BackGround()¶ The function is not used
1 2 3 4 5 6 7 8 9 10 11 12 13 14 15 16 17 18 19 20 21 22 23 24 25 26 27 28 29 30 31 32 33 34 35 36 37 38 39 40 41 42 43 44 45 46 47 48 49 50 51 52 53 54 55 56 57 58 59 60 61 62 63 64 65 66 67 68 69 70 71 72 73 74 75 76 77 78 79 80 81 82 83 84 85 86 87 88 89 90 91 92 93 94 95 96 97 98 99 100 101 102 103 104 105 106 107 108 109 110 111 112 113 114 115 116 117 118 119 120 121 122 123 124 125 126 127 128 129 130 131 132 133 134 135 136 137 138 139 140 141 142 143 144 145 146 147 148 149 150 151 152 153 154 155 156 157 158 159 160 161 162 163 164 165 166 167 168 169 170 171 172 173 174 175 176 | }
/**
*The function returns the filter options for the header "BENEFICIARY_INFO/Age"
*/
function filterBenefAge(ops, y, x, item, header) {
/*idx {string } - year*/
var idx = key["idx"];
var sst = SpreadsheetApp.openById(idx);
var filtersheet = sst.getSheetByName("Filter");
var rng = filtersheet.getRange(y, x); //Country Select
var Other = 0;
var list = [];
if (header == "BENEFICIARY_INFO/Age") {
for (i = 0; i < item.length; i++) {
if (jsonData[i]["FILTER"] != 1) {
continue;
}
if (item[i][header] < 18) {
if (list.indexOf("Under 18") == -1) {
list.push("Under 18");
}
} else {
if (item[i][header] > 65) {
if (list.indexOf("Over 65") == -1) {
list.push("Over 65");
}
} else {
if (list.indexOf("18-65") == -1) {
list.push("18-65");
}
}
}
}
} else {
for (i = 0; i < item.length; i++) {
if (jsonData[i]["FILTER"] != 1) {
continue;
}
if (item[i][header] != 0 && item[i][header] != null && list.indexOf(item[i][header]) == -1) {
list.push(item[i][header]);
}
if (item[i][header] == 0) {
Other = 1;
}
}
}
list.sort();
if (Other == 1) {
list.push("Other");
}
list.unshift("ALL");
var rule = SpreadsheetApp
.newDataValidation()
.requireValueInList(list, true)
.build();
rng.clearDataValidations();
rng.setDataValidation(rule);
//rng.setValue("ALL");
}
/**
* The function is not used
*/
function BackGround() {
/*idx {string } - year*/
var idx = key["idx"];
var sst = SpreadsheetApp.openById(idx);
var sheetbg = sst.getSheetByName("BG");
var lr = sheetbg.getLastRow() + 1;
var country = [];
var partner = [];
var camp = [];
var status = [];
var gender = [];
var age = [];
var year = [];
var host = [];
var ii = 0,
iii = 0,
iiii = 0,
i5 = 0,
i6 = 0,
i7 = 0,
i8 = 0,
i9 = 0;
var age1 = 18,
age2 = 65,
agecount1 = 0,
agecount2 = 0,
agecount3 = 0;
sheetbg.getRange(1, 1, lr + 1, 20).clear();
for (i = 0; i < jsonData.length; i++) {
//if(jsonData[i]["FILTER"]!=1){continue;}
if (filterMain(i, jsonData, Country, Partner, Camp, Status, Year, Gender, Age, "ALL", '0', '0') != 9) {
continue;
}
if (country.indexOf(jsonData[i]["Country"]) == -1) {
country[ii] = jsonData[i]["Country"];
ii++;
}
if (partner.indexOf(jsonData[i]["PARTNER_INFO/PARTNER"]) == -1) {
partner[iii] = jsonData[i]["PARTNER_INFO/PARTNER"];
iii++;
}
if (jsonData[i]["PARTNER_INFO/Camp"] != "" && jsonData[i]["PARTNER_INFO/Camp"] != 0 && camp.indexOf(jsonData[i]["PARTNER_INFO/Camp"]) == -1) {
camp[iiii] = jsonData[i]["PARTNER_INFO/Camp"];
iiii++;
} else {
if (jsonData[i]["PARTNER_INFO/Camp"] == "0" && camp.indexOf("Other") == -1) {
camp[iiii] = "Other";
iiii++;
}
}
if (status.indexOf(jsonData[i]["BENEFICIARY_INFO/Status"]) == -1) {
status[i5] = jsonData[i]["BENEFICIARY_INFO/Status"];
i5++;
}
if (gender.indexOf(jsonData[i]["BENEFICIARY_INFO/Gender"]) == -1) {
gender[i6] = jsonData[i]["BENEFICIARY_INFO/Gender"];
i6++;
}
if (jsonData[i]["BENEFICIARY_INFO/Age"] < 18) {
agecount1++;
if (age.indexOf("Under 18") == -1) {
age[i7] = "Under 18";
i7++;
}
} else {
if (jsonData[i]["BENEFICIARY_INFO/Age"] > 65) {
agecount2++;
if (age.indexOf("Over 65") == -1) {
age[i7] = "Over 65";
i7++;
}
} else {
agecount3++;
if (age.indexOf("18-65") == -1) {
age[i7] = "18-65";
i7++;
}
}
}
if (year.indexOf(jsonData[i]["MonitoringYear"]) == -1) {
year[i8] = jsonData[i]["MonitoringYear"];
i8++;
}
if (jsonData[i]["PARTNER_INFO/Nearby_Camp"] != "" && jsonData[i]["PARTNER_INFO/Nearby_Camp"] != 0 && host.indexOf(jsonData[i]["PARTNER_INFO/Nearby_Camp"]) == -1) {
host[i9] = jsonData[i]["PARTNER_INFO/Nearby_Camp"];
i9++;
} else {
if (jsonData[i]["PARTNER_INFO/Nearby_Camp"] != "" && host.indexOf("Other") == -1) {
host[i9] = "Other";
i9++;
}
}
}
|
Function filterMain
-
filterMain(taskname, i, item, Country, Partner, Camp, Status, Year, Gender, Age, Line, AC1, AC2)¶ The function returns the filter options
- Arguments
taskname (string) –
i (string) –
item (string) –
Country (string) –
Partner (string) –
Camp (string) –
Status (string) – the beneficiary type
Year (string) –
Gender (string) –
Age (string) –
Line (string) –
AC1 (string) –
AC2 (string) –
1 2 3 4 5 6 7 8 9 10 11 12 13 14 15 16 17 18 19 | output3[ic] = new Array();
output3[ic][0] = camp[ic];
output3[ic][1] = countTotalNumCategoryIndicator2Agr(jsonData, "PARTNER_INFO/Camp", [[camp[ic]]], "ALL", 0);
}
try {
sheetbg.getRange(1, 5, camp.length, 2).setValues(output3);
} catch (e) { }
var output4 = [];
for (id = 0; id < status.length; id++) {
output4[id] = new Array();
output4[id][0] = status[id];
output4[id][1] = countTotalNumCategoryIndicator2Agr(jsonData, "BENEFICIARY_INFO/Status", [[status[id]]], "ALL", 0);
}
sheetbg.getRange(1, 7, status.length, 2).setValues(output4);
var output5 = [];
for (ie = 0; ie < gender.length; ie++) {
output5[ie] = new Array();
|
Function filterInitial
-
filterInitial(i, item, Country, Partner, Camp, Status, Year, Gender, Age, line, AC1, AC2)¶ The function is not used
1 2 3 4 5 6 7 8 9 10 11 12 13 14 15 16 17 18 19 20 21 22 23 24 25 26 27 28 29 30 31 32 33 34 35 36 37 38 39 40 41 42 43 44 45 46 47 48 49 50 51 52 53 54 55 56 57 58 | for (ig = 0; ig < age.length; ig++) {
sheetbg.getRange(ig + 1, 11).setValue(age[ig]);
if (age[ig] == "Under 18") {
sheetbg.getRange(ig + 1, 12).setValue(agecount1)
}
if (age[ig] == "Over 65") {
sheetbg.getRange(ig + 1, 12).setValue(agecount2)
}
if (age[ig] == "18-65") {
sheetbg.getRange(ig + 1, 12).setValue(agecount3)
}
}
var output6 = [];
for (ih = 0; ih < year.length; ih++) {
output6[ih] = new Array();
output6[ih][0] = year[ih];
output6[ih][1] = countTotalNumCategoryIndicator2Agr(jsonData, "MonitoringYear", [[year[ih]]], "ALL", 0);
}
sheetbg.getRange(1, 13, year.length, 2).setValues(output6);
var output7 = [];
for (ij = 0; ij < host.length; ij++) {
output7[ij] = new Array();
output7[ij][0] = host[ij];
output7[ij][1] = countTotalNumCategoryIndicator2Agr(jsonData, "PARTNER_INFO/Nearby_Camp", [[host[ij]]], "ALL", 0);
}
try {
sheetbg.getRange(1, 15, host.length, 2).setValues(output7);
} catch (e) { }
}
/**
* The function returns the filter options
* @param {string} taskname
* @param {string} i
* @param {string} item
* @param {string} Country
* @param {string} Partner
* @param {string} Camp
* @param {string} Status - the beneficiary type
* @param {string} Year
* @param {string} Gender
* @param {string} Age
* @param {string} Line
* @param {string} AC1
* @param {string} AC2
*/
function filterMain(i, item, Country, Partner, Camp, Status, Year, Gender, Age, line, AC1, AC2) {
var result = 0;
if (jsonData[i]["FILTER"] == 1) {
result = 7;
} else {
return result;
}
if (line == "ALL" || item[i]["PARTNER_INFO/BE"] == line) {
result++;
|
Function generateTableIndicator41AgrEmpl
-
generateTableIndicator41AgrEmpl(clm, newclm, item, header)¶ The function generates the table on Country Abalysis note [4.1 AGRICULTURAL EMPLOYMENT > Table: % of forcibly displaced targeted who are wage/self employed on a permanent / monthly / seasonal basis in the agricultural sector]
- Arguments
clm (array) – array of columns
newclm (array) – array of new columns
item (array) – data
header (header) – headers
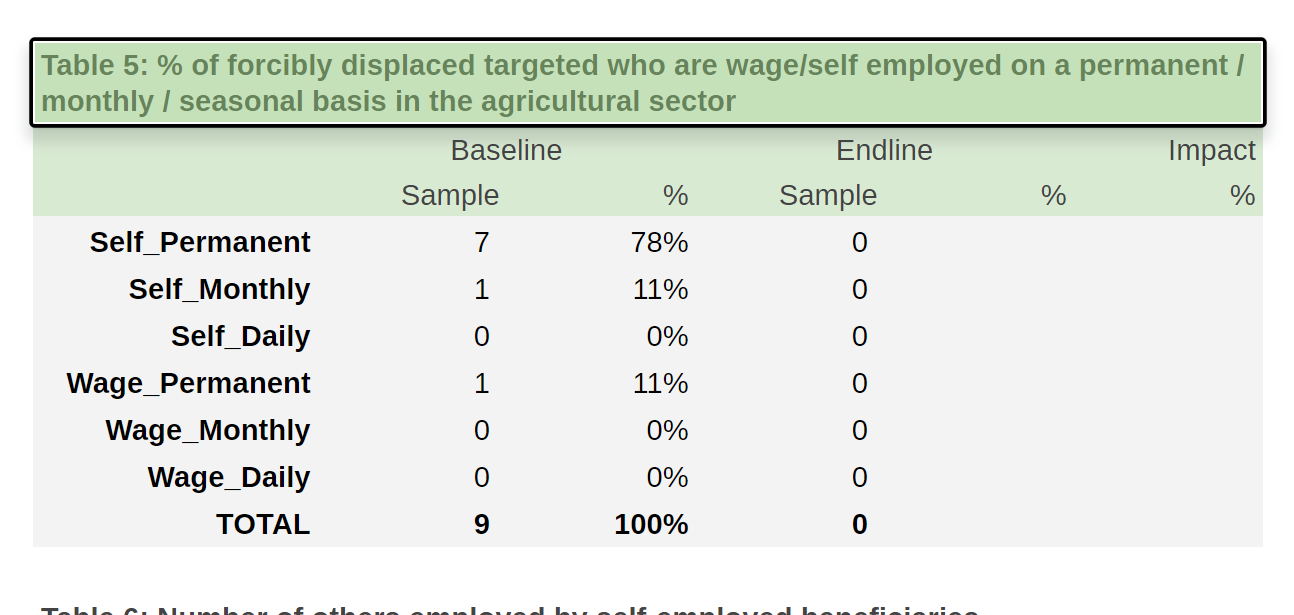
Screenshot of Table
1 2 3 4 5 6 7 8 9 10 11 12 13 14 15 16 17 18 19 20 21 22 23 24 25 26 27 28 29 30 31 32 33 34 35 36 37 38 39 40 41 42 43 44 45 46 47 48 49 50 51 52 53 54 55 56 57 58 59 | result++;
if (Year == "ALL" || item[i]["MonitoringYear"] == Year) {
result++;
if (Gender == "ALL" || item[i]["BENEFICIARY_INFO/Gender"] == Gender) {
result++;
if (line == "ALL" || item[i]["PARTNER_INFO/BE"] == line) {
result++;
if (AC1 == "0" || item[i][AC1] == AC2) {
result++;
if (Age != "ALL") {
if (Age == "Under 18") {
if (item[i]["BENEFICIARY_INFO/Age"] < 18) {
result++;
}
} else {
if (Age == "Over 65") {
if (item[i]["BENEFICIARY_INFO/Age"] > 65) {
result++;
}
} else {
if (item[i]["BENEFICIARY_INFO/Age"] <= 65 && item[i]["BENEFICIARY_INFO/Age"] >= 18) {
result++
}
}
}
} else {
result++;
}
}
}
}
}
}
}
}
}
return result;
}
/**
* The function filterfilter33 was removed
*/
}
{ /*Graph*/
/*Horizontal*/
/**
* The function columngraphvv was removed
*/
/**
* The function tablegraph was replaced
*/
|
Function generateTableIndicator42AgrProduc
-
generateTableIndicator42AgrProduc(item, header, kg, hectare, unitproduction, unitland)¶ The function generates table [4.2 AGRICULTURAL PRODUCTIVITY >Table 7: Land productivity (yield in kg/hectare) per self-employed beneficiaries (last season)]
- Arguments
item (type) –
header (type) –
kg (type) –
hectare (type) –
unitproduction (type) –
unitland (type) –
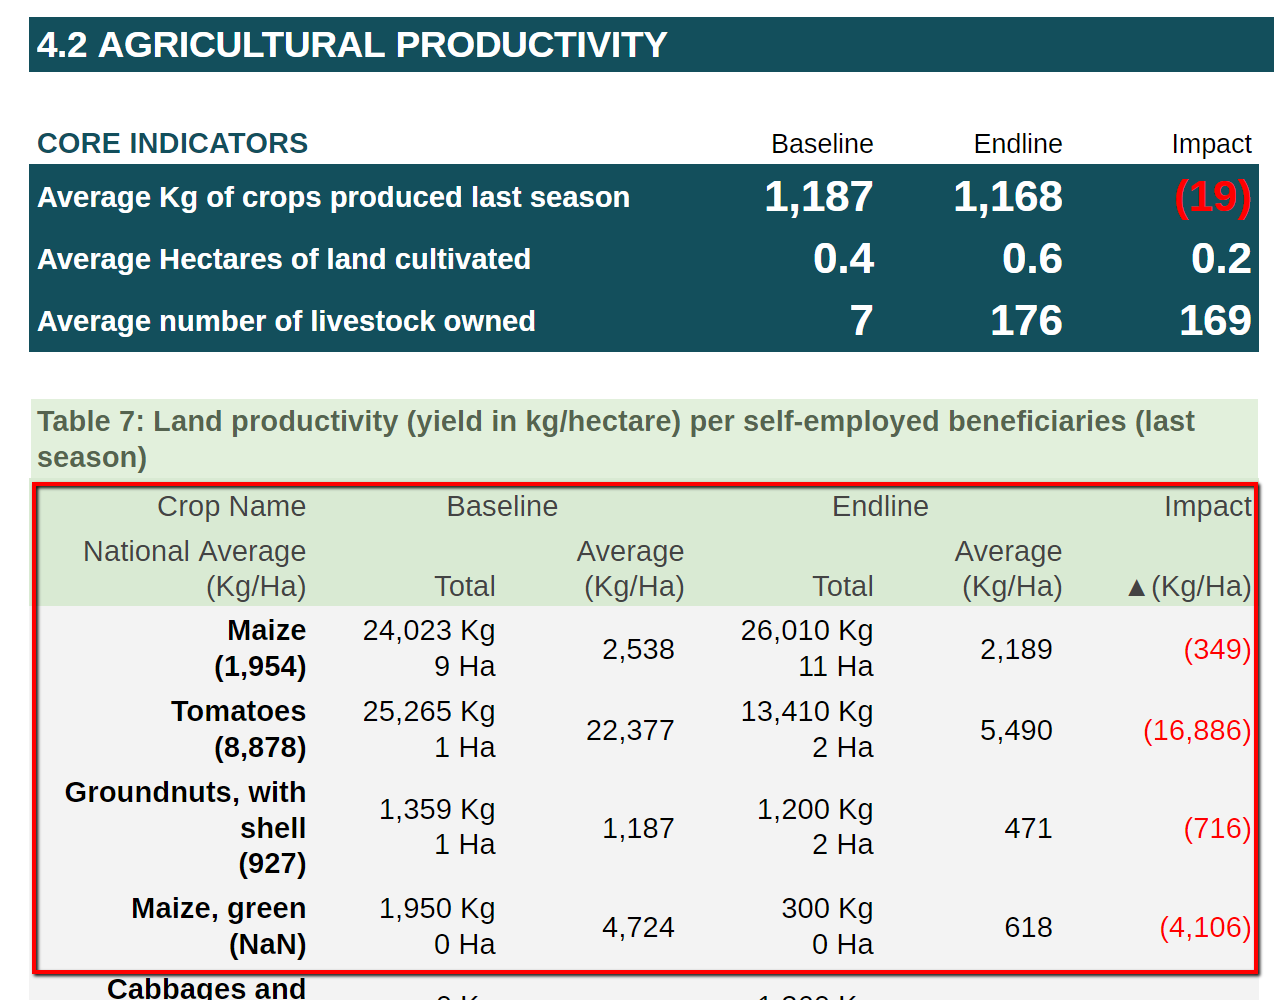
Screenshot of Table
1 2 3 4 5 6 7 8 9 10 11 12 13 14 15 16 17 18 19 20 21 22 23 24 25 26 27 28 29 30 31 32 33 34 35 36 37 38 39 40 41 42 43 44 45 46 47 48 49 50 51 52 53 54 55 56 57 58 59 60 61 62 63 64 65 66 67 68 69 70 71 72 73 74 75 76 77 78 79 80 81 82 83 84 85 86 87 88 89 90 91 92 93 94 95 96 97 98 99 100 101 102 103 104 105 106 107 108 109 110 111 112 113 114 115 116 117 118 119 120 121 122 123 124 125 126 127 128 129 130 131 132 133 134 135 136 137 138 139 140 141 142 143 144 145 146 147 148 149 150 151 152 | for (h1 = 0; h1 < clm.length; h1++) {
for (h2 = 0; h2 < clm[h1].length; h2++) {
kk++;
for (h3 = 0; h3 < clm.length; h3++) {
for (h4 = 0; h4 < clm[h3].length; h4++) {
if (clm[h3][h4].indexOf(clm[h1][h2]) > -1) {
k++;
}
}
}
}
}
if (k > kk) {
cc = 0;
}
tb[0] = new Array();
tb[0][0] = "";
tb[0][1] = "Baseline Sample";
tb[0][2] = "Baseline %";
tb[0][3] = "Endline Sample";
tb[0][4] = "Endline %";
tb[0][5] = "Change";
for (h = 0; h < clm.length; h++) {
TotalB = TotalB + countTotalNumCategoryIndicator2Agr(item, header, clm[h], "Baseline", cc);
TotalE = TotalE + countTotalNumCategoryIndicator2Agr(item, header, clm[h], "Endline", cc);
}
for (iz = 0; iz < clm.length; iz++) {
var cvalue = clm[iz];
tb[iz + 1] = new Array();
tb[iz + 1][0] = newclm[iz];
tb[iz + 1][1] = countTotalNumCategoryIndicator2Agr(item, header, cvalue, "Baseline", cc);
tb[iz + 1][2] = countTotalNumCategoryIndicator2Agr(item, header, cvalue, "Baseline", cc) / TotalB;
tb[iz + 1][3] = countTotalNumCategoryIndicator2Agr(item, header, cvalue, "Endline", cc);
tb[iz + 1][4] = countTotalNumCategoryIndicator2Agr(item, header, cvalue, "Endline", cc) / TotalE;
tb[iz + 1][5] = countTotalNumCategoryIndicator2Agr(item, header, cvalue, "Endline", cc) / TotalE - countTotalNumCategoryIndicator2Agr(item, header, cvalue, "Baseline", cc) / TotalB;
}
tb[iz + 1] = new Array();
tb[iz + 1][0] = "TOTAL";
tb[iz + 1][1] = TotalB;
tb[iz + 1][2] = TotalB / TotalB;
tb[iz + 1][3] = TotalE;
tb[iz + 1][4] = TotalE / TotalE;
tb[iz + 1][5] = "";
return tb;
}
/*function TableCount was removed [12-10-2019]*/
/*function TablePercent2 was removed [12-10-2019]*/
/*function TablePercentOutput3 was removed [12-10-2019]*/
/*function tableset was removed [12-10-2019]*/
}
{ /*AGRICULTURE*/
var lr;
var unitconversion;
/**
* The function generates table [4.2 AGRICULTURAL PRODUCTIVITY >Table 7: Land productivity (yield in kg/hectare) per self-employed beneficiaries (last season)]
* @param {type} item
* @param {type} header
* @param {type} kg
* @param {type} hectare
* @param {type} unitproduction
* @param {type} unitland
*/
function generateTableIndicator42AgrProduc(item, header, kg, hectare, unitproduction, unitland) {
/*idx {string } - year*/
var idx = key["idx"];
/*sst {object} - spreadsheet object with the given id [Opens the spreadsheet with the given ID]*/
var sst = SpreadsheetApp.openById(idx);
/*faosheet {type} -the sheet with the given name [FAO sheet]*/
var faosheet = sst.getSheetByName("FAO");
var otherlist = [];
var others = "";
var o = 0;
var list = [];
var FAO = faosheet.getRange(1, 1, faosheet.getLastRow(), faosheet.getLastColumn()).getValues();
for (iz = 0; iz < header.length; iz++) {
for (i = 0; i < item.length; i++) {
if (filterMain(i, item, Country, Partner, Camp, Status, Year, Gender, Age, "ALL", '0', '0') != 9) {
continue;
}
if (item[i][header[iz]] == "NA") {
continue;
}
if (item[i][header[iz]] != 0 && item[i][header[iz]] != "Other" && item[i][header[iz]] != null && list.indexOf(item[i][header[iz]]) == -1) {
list.push(item[i][header[iz]]);
}
if (item[i][header[iz]] == "Other") {
o = 1;
}
}
}
list.sort();
var tb = [];
var TotalB = 0;
var TotalE = 0;
var blkg = new Array();
var blhec = new Array();
var elkg = new Array();
var elhec = new Array();
for (ic = 0; ic < list.length; ic++) {
blkg[ic] = 0;
blhec[ic] = 0;
elkg[ic] = 0;
elhec[ic] = 0;
}
tb[0] = new Array();
tb[0][0] = "Crop Name";
tb[0][1] = "Baseline";
tb[0][2] = "";
tb[0][3] = "Endline";
tb[0][4] = "";
tb[0][5] = "Impact";
tb[0][6] = "";
tb[0][7] = "X";
tb[0][8] = "X";
tb[1] = new Array();
tb[1][0] = "National Average" + String.fromCharCode(10) + "(Kg/Ha)";
tb[1][1] = "Total";
tb[1][2] = "Average" + String.fromCharCode(10) + "(Kg/Ha)";
tb[1][3] = "Total";
tb[1][4] = "Average" + String.fromCharCode(10) + "(Kg/Ha)";
tb[1][5] = "▲(Kg/Ha)";
tb[1][6] = ""; //"(Kg/Ha)";
tb[1][7] = "X";
tb[1][8] = "X";
for (i2 = 0; i2 < list.length; i2++) {
for (hh = 0; hh < header.length; hh++) {
blkg[i2] = blkg[i2] + countNumIndicator4Agricul(item, header[hh], list[i2], kg[hh], unitproduction[hh], "Baseline", 1);
blhec[i2] = blhec[i2] + countNumIndicator4Agricul(item, header[hh], list[i2], hectare[hh], unitland[hh], "Baseline", 1);
elkg[i2] = elkg[i2] + countNumIndicator4Agricul(item, header[hh], list[i2], kg[hh], unitproduction[hh], "Endline", 1);
elhec[i2] = elhec[i2] + countNumIndicator4Agricul(item, header[hh], list[i2], hectare[hh], unitland[hh], "Endline", 1);
}
}
|
Function generateTableIndicator42AgrProducAnimal
-
generateTableIndicator42AgrProducAnimal(item, header, number)¶ The function generates table [4.2 AGRICULTURAL PRODUCTIVITY > Table 8: Total number of animal owned by the self-employed beneficiaries]
- Arguments
item (array) – JSON data
header (array) –
number (array) –
- Returns
array – List of values.
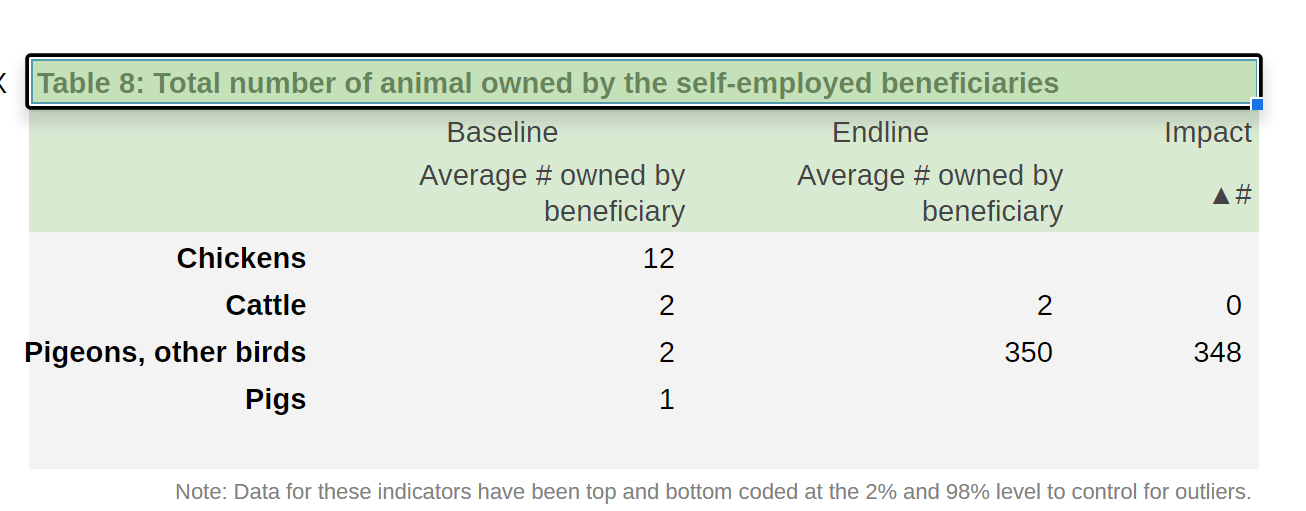
Screenshot of Table
1 2 3 4 5 6 7 8 9 10 11 12 13 14 15 16 17 18 19 20 21 22 23 24 25 26 27 28 29 30 31 32 33 34 35 36 37 38 39 40 41 42 43 44 45 46 47 48 49 50 51 52 53 54 55 56 57 58 59 60 61 62 63 64 65 66 67 68 69 70 71 72 73 74 75 76 77 78 79 80 81 82 83 84 85 86 87 88 89 90 91 92 93 94 95 96 97 98 99 100 101 102 103 104 105 106 107 108 | var blhec2 = Math.floor(blhec1);
var blhec3 = Math.round(blhec2);
var elkg1 = Math.round(elkg[iz] * 10) / 10;
var elkg2 = Math.floor(elkg1);
var elkg3 = Math.round(elkg2);
var elhec1 = Math.round(elhec[iz] * 10) / 10;
var elhec2 = Math.floor(elhec1);
var elhec3 = Math.round(elhec2);
var FAOS = "NA";
for (f = 0; f < FAO.length; f++) {
if (Country != "ALL" && FAO[f][0] == Country && FAO[f][1] == list[iz]) {
FAOS = FAO[f][2];
break;
}
if (Country == "ALL" && FAO[f][0] == "World" && FAO[f][1] == list[iz]) {
FAOS = FAO[f][2];
break;
}
}
tb[u] = new Array();
tb[u][0] = list[iz] + String.fromCharCode(10) + "(" + String(Math.round(FAOS)).replace(/(\d)(?=(\d{3})+(?!\d))/g, '$1,') + ")";
tb[u][1] = String(blkg3).replace(/(\d)(?=(\d{3})+(?!\d))/g, '$1,') + " Kg" + String.fromCharCode(10) + String(blhec3).replace(/(\d)(?=(\d{3})+(?!\d))/g, '$1,') + " Ha";
if (blhec1 > 0) { tb[u][2] = blkg[iz] / blhec[iz]; } else { tb[u][2] = ""; }
tb[u][3] = String(elkg3).replace(/(\d)(?=(\d{3})+(?!\d))/g, '$1,') + " Kg" + String.fromCharCode(10) + String(elhec3).replace(/(\d)(?=(\d{3})+(?!\d))/g, '$1,') + " Ha";;
if (elhec1 > 0) {
tb[u][4] = elkg[iz] / elhec[iz];;
if (blhec1 > 0) { tb[u][5] = tb[u][4] - tb[u][2]; } else { tb[u][5] = ""; }
} else {
tb[u][4] = "";
tb[u][5] = "";
}
//FAO STANDARD
tb[u][6] = FAOS;
tb[u][7] = blkg3 + elkg3;
tb[u][8] = blhec3 + elhec3;
u++;
}
tb[u] = new Array();
tb[u][0] = "";
tb[u][1] = "";
tb[u][2] = "";
tb[u][3] = "";
tb[u][4] = "";
tb[u][5] = "";
tb[u][6] = "";
tb[u][7] = "";
tb[u][8] = "";
return tb;
}
}
{ /*ANIMAL*/
/**
* The function TableCountAnimal was removed
*/
/**
* The function generates table [4.2 AGRICULTURAL PRODUCTIVITY > Table 8: Total number of animal owned by the self-employed beneficiaries]
* @param {array} item - JSON data
* @param {array} header
* @param {array} number
* @returns {array} List of values.
*/
function generateTableIndicator42AgrProducAnimal(item, header, number) {
var list = [];
for (iz = 0; iz < header.length; iz++) {
for (i = 0; i < item.length; i++) {
/*returns filter selection*/
if (filterMain(i, item, Country, Partner, Camp, Status, Year, Gender, Age, "ALL", '0', '0') != 9) {
continue;
}
if (item[i][header[iz]] == "NA") {
continue;
}
if (item[i][header[iz]] == "Other") {
continue;
}
if (item[i][header[iz]].toString() == "0") { continue; }
if (item[i][header[iz]].toString().replace(/(^\s+)|(\s+$)/g, "") != "" && item[i][header[iz]] != null && list.indexOf(item[i][header[iz]].toString().replace(/(^\s+)|(\s+$)/g, "")) == -1) {
list.push(item[i][header[iz]].toString().replace(/(^\s+)|(\s+$)/g, ""));
}
if (item[i][header[iz]] == "Other") {
o = 1;
}
}
}
list.sort();
var tb = [];
var TotalB = new Array();
var TotalE = new Array();
/*baseline*/
var bl = new Array();
/*endline*/
var el = new Array();
for (ic = 0; ic < list.length; ic++) {
bl[ic] = 0;
|
Function generateTablePercentIndicatorImpact
-
generateTablePercentIndicatorImpact(clm, newclm, item, header, skip)¶ The function generates tables [4. OUTPUT 1: ACCESS TO AGRICULTURE PRODUCTION ENHANCED > Table “Sample beneficiaries per agricultural sub-sectors”, Table “Interventions provided to sample beneficiaries by type”],[5. OUTPUT 2: ACCESS TO SELF-EMPLOYMENT FACILITATED > Table ” Interventions provided to sample beneficiaries by type”]
- Arguments
clm (array) – array of columns
newclm (array) – array of new columns
item (array) – data
header (header) – headers
skip (type) –
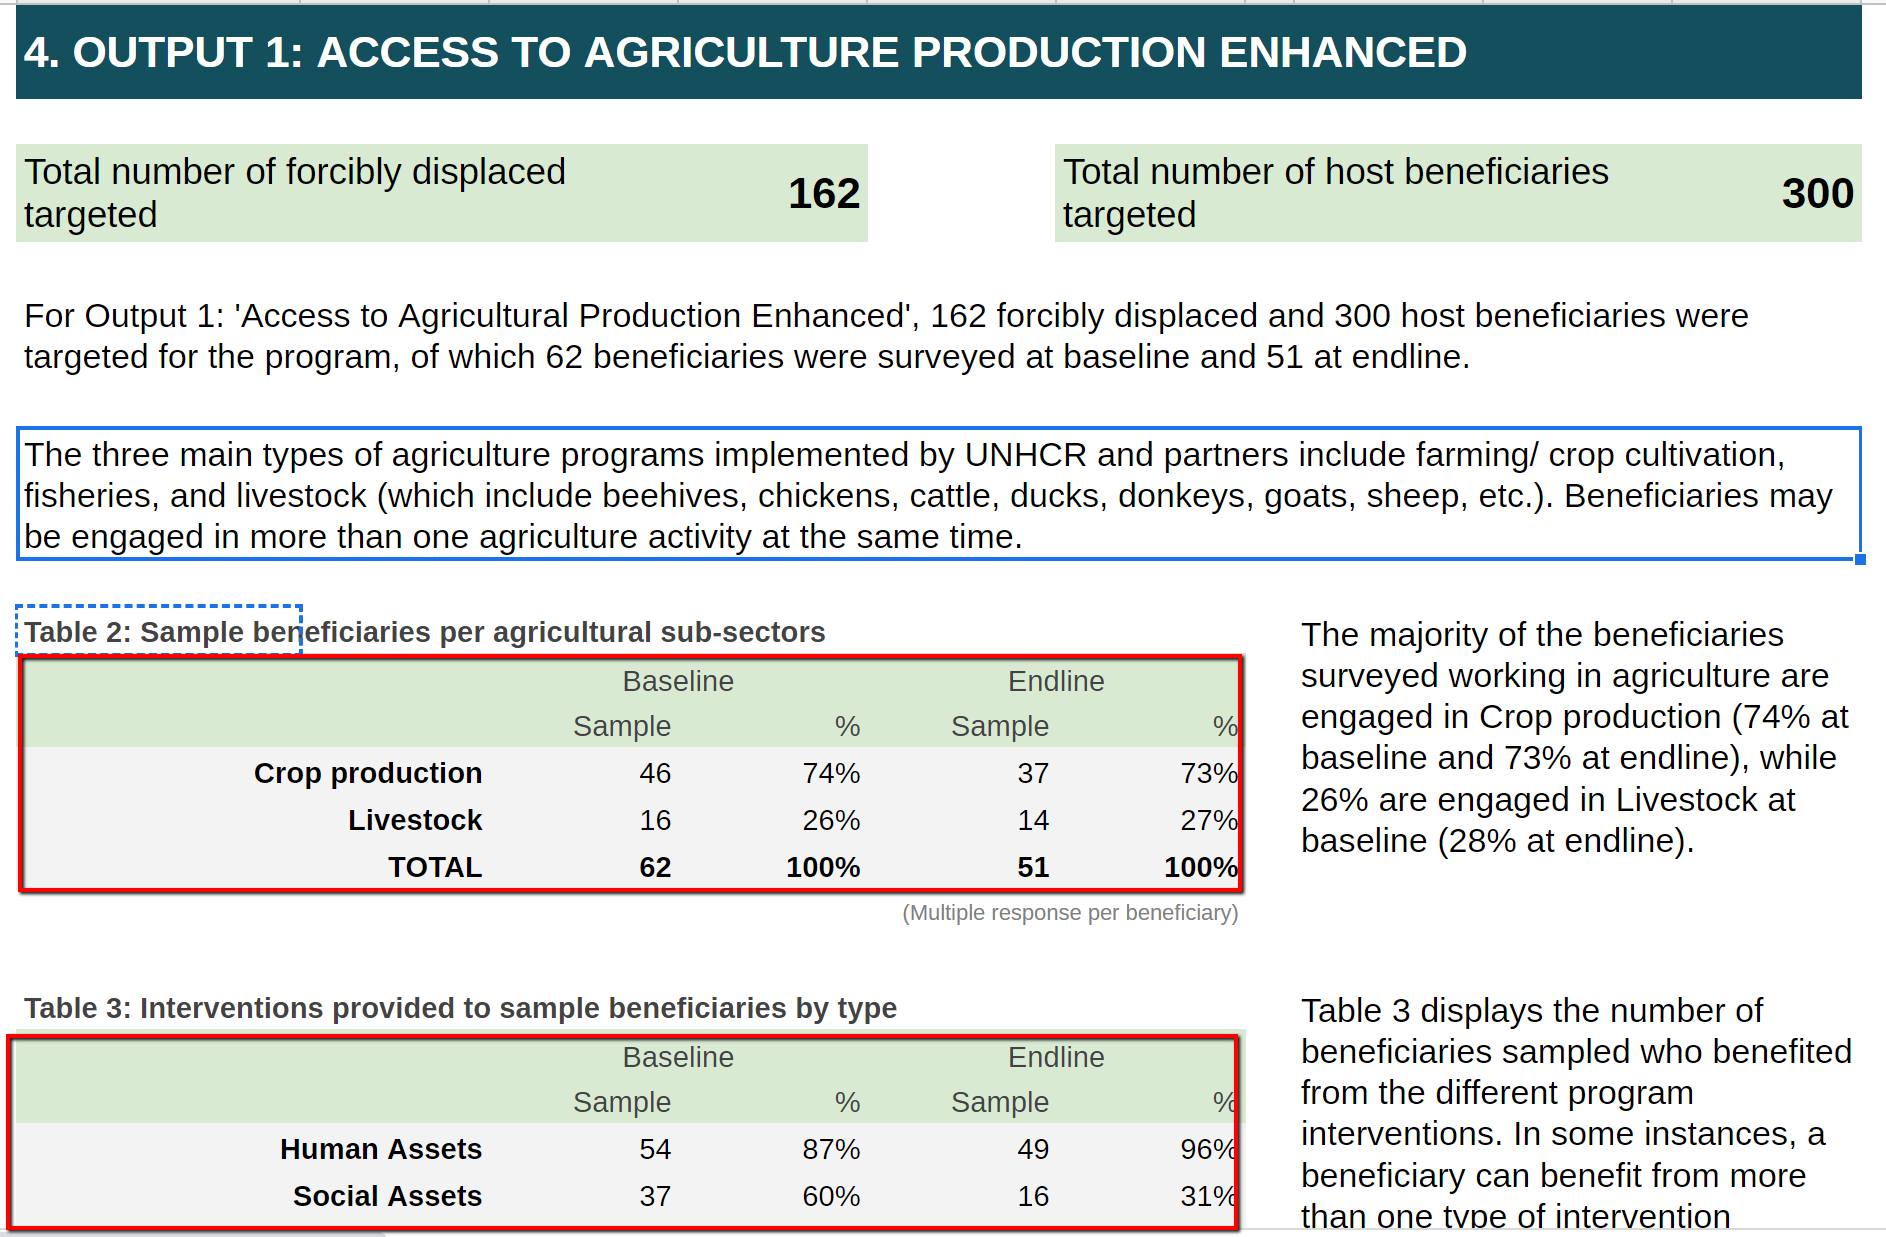
Screenshot of Tables
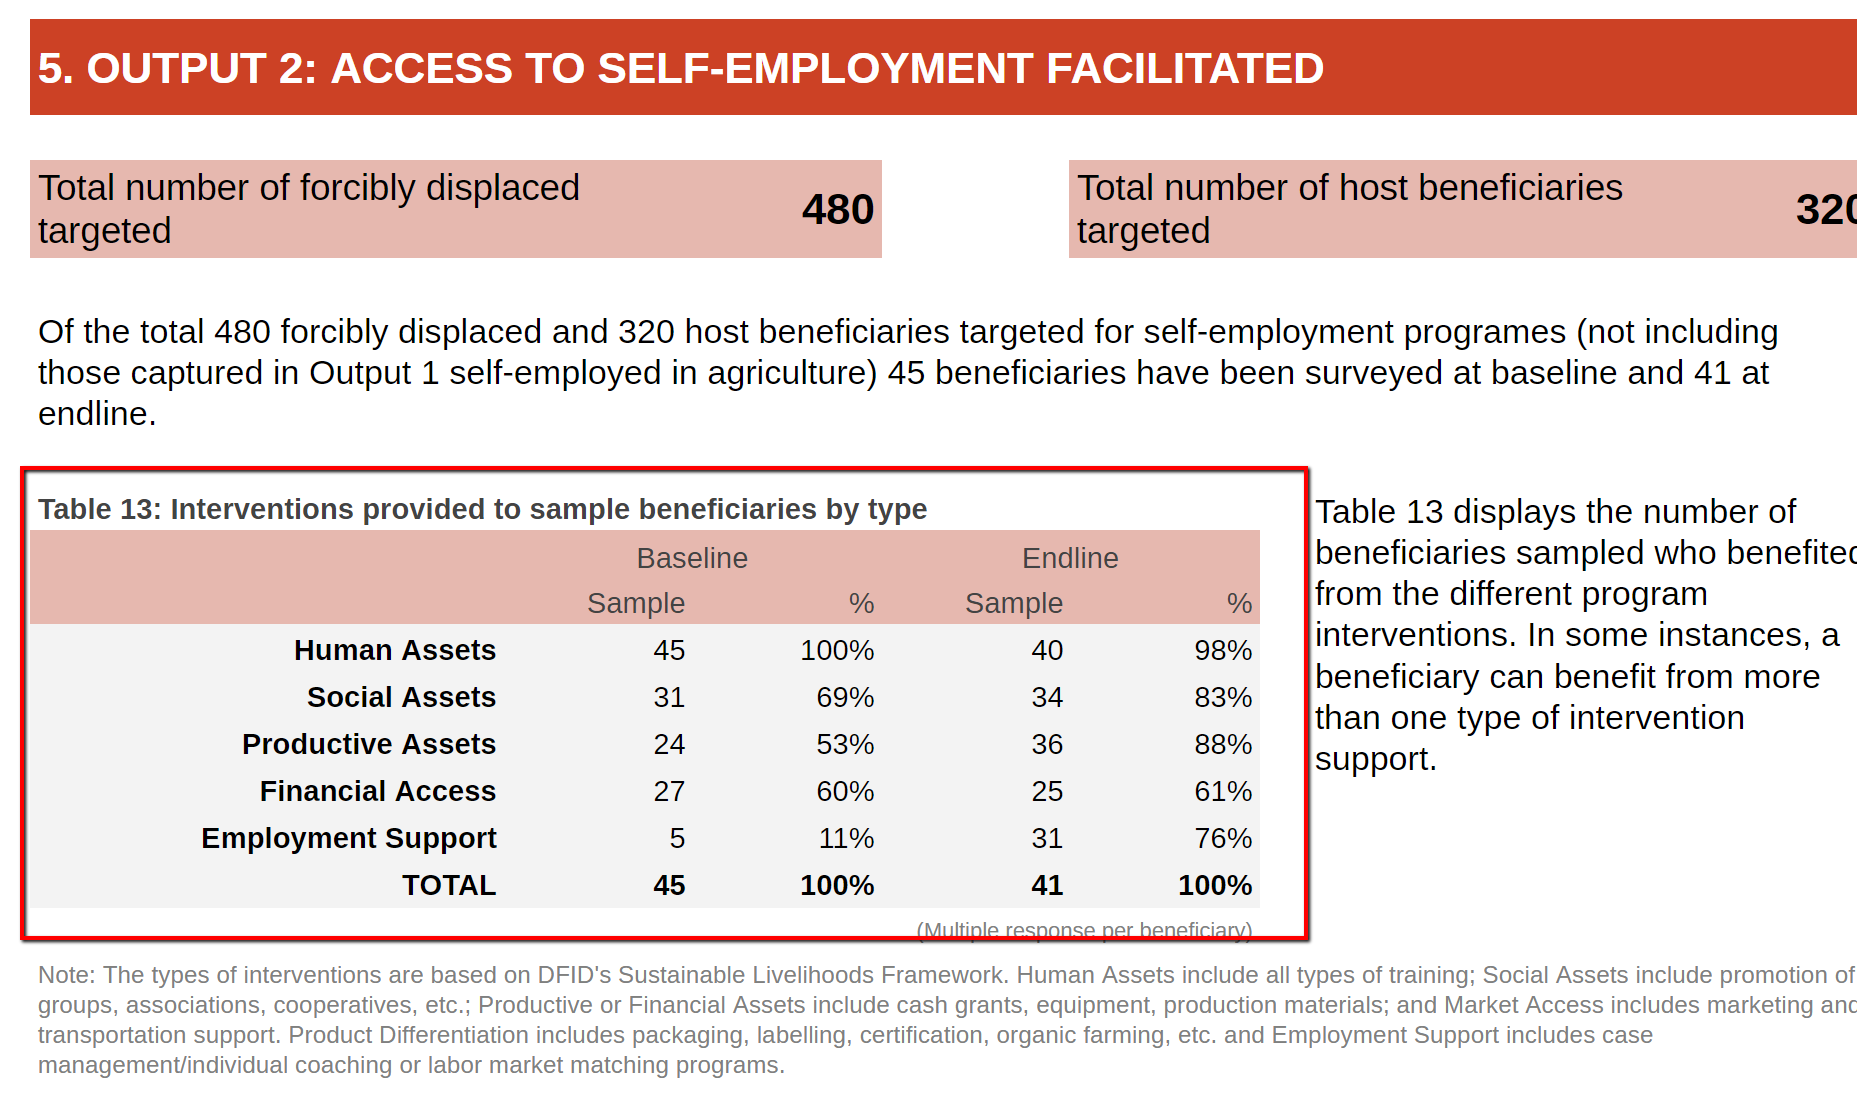
Screenshot of Table
1 2 3 4 5 6 7 8 9 10 11 12 13 14 15 16 17 18 19 20 21 22 23 24 25 26 27 28 29 30 31 32 33 34 35 36 37 38 39 40 41 42 43 44 45 46 47 48 49 50 51 52 53 54 55 56 57 58 59 60 61 62 63 64 65 66 67 68 69 70 71 72 73 74 75 76 77 78 79 80 81 82 83 84 85 86 87 88 89 90 91 92 93 94 95 96 97 98 99 100 101 102 103 | tb[1][0] = "";
tb[1][1] = "Total";
tb[1][2] = "Average";
tb[1][3] = "Total";
tb[1][4] = "Average";
tb[1][5] = "#";
tb[1][6] = "X";
for (i2 = 0; i2 < list.length; i2++) {
for (hh = 0; hh < header.length; hh++) {
bl[i2] = bl[i2] + countNumAnimalsIndicator4(item, header[hh], list[i2], number[hh], "Baseline", 1);
el[i2] = el[i2] + countNumAnimalsIndicator4(item, header[hh], list[i2], number[hh], "Endline", 1);
}
}
u = 2;
for (iz = 0; iz < list.length; iz++) {
tb[u] = new Array();
tb[u][0] = list[iz];
tb[u][1] = bl[iz];
if (TotalB[iz] > 0) { tb[u][2] = bl[iz] / TotalB[iz]; } else { tb[u][2] = ""; }
tb[u][3] = el[iz];
if (TotalE[iz] > 0) {
tb[u][4] = el[iz] / TotalE[iz];
if (TotalB[iz] > 0) { tb[u][5] = tb[u][4] - tb[u][2]; } else { tb[u][5] = ""; }
} else {
tb[u][4] = "";
tb[u][5] = "";
}
tb[u][6] = parseInt(bl[iz]);
u++;
blaverageanimal = blaverageanimal + bl[iz];
blbene = blbene + TotalB[iz];
elavarageanimal = elavarageanimal + el[iz];
elbene = elbene + TotalE[iz];
}
tb[u] = new Array();
tb[u][0] = "";
tb[u][1] = "";
tb[u][2] = "";
tb[u][3] = "";
tb[u][4] = "";
tb[u][5] = "";
tb[u][6] = "";
return tb;
}
}
{
/*function SendEmail was removed [12-10-2019]*/
/*function SendEmail2 was removed [12-10-2019]*/
/*function SendEmail3 was removed [12-10-2019]*/
/*function SendEmail4 was removed [12-10-2019]*/
}
{
var totaloutputbl = 0;
var totaloutputel = 0;
/**
* The function generates tables [4. OUTPUT 1: ACCESS TO AGRICULTURE PRODUCTION ENHANCED > Table "Sample beneficiaries per agricultural sub-sectors", Table "Interventions provided to sample beneficiaries by type"],[5. OUTPUT 2: ACCESS TO SELF-EMPLOYMENT FACILITATED > Table " Interventions provided to sample beneficiaries by type"]
* @param {array} clm - array of columns
* @param {array} newclm - array of new columns
* @param {array} item - data
* @param {header} header - headers
* @param {type} skip
*/
function generateTablePercentIndicatorImpact(clm, newclm, item, header, skip) {
var tb = [];
var TotalB = 0;
var TotalE = 0;
var bl = new Array();
var el = new Array();
var cc = 1;
var k = 0,
kk = 0;
for (h1 = 0; h1 < clm.length; h1++) {
for (h2 = 0; h2 < clm[h1].length; h2++) {
kk++;
for (h3 = 0; h3 < clm.length; h3++) {
for (h4 = 0; h4 < clm[h3].length; h4++) {
if (clm[h3][h4].indexOf(clm[h1][h2]) > -1) {
k++;
}
}
}
}
}
if (k > kk) {
cc = 0;
}
for (ic = 0; ic < clm.length; ic++) {
bl[ic] = 0;
el[ic] = 0;
|
Function generateTablePercentIndicatorImpactChange
-
generateTablePercentIndicatorImpactChange(clm, newclm, item, header, skip, AC1, AC2)¶ The function generates the values for tables [3. SAMPLE SIZE PER OUTPUT > Table ” Number of beneficiaries per livelihoods output surveyed” ],[4.1 AGRICULTURAL EMPLOYMENT > Table “% of forcibly displaced targeted who are wage/self employed in the agricultural sector”, Table “of forcibly displaced targeted who are wage/self employed on a permanent / monthly / seasonal basis in the agricultural sector”,Table “Number of others employed by self-employed beneficiaries”],[4.3 INCOME/SAVING GAINED FROM AGRICULTURE > Core indicators table],[5.1 SELF-EMPLOYMENT > Table “% of forcibly displaced targeted who are self-employed”; Table “% of forcibly displaced targeted who are self-employed in the formal/informal sector”, Table “% of forcibly displaced targeted with own business / self-employed for (6/12) months or more”],[5.2 INCOME/SAVING GAINED FROM SELF-EMPLOYMENT > Table ” % of forcibly displaced targeted who self-report (decreased/maintained/increased) income compared to previous year” , Table “: % of forcibly displaced targeted who self-report (decreased/maintained/increased) income compared to previous year “]
- Arguments
clm (array) – array of columns
newclm (array) – array of new columns
item (array) – data
header (header) – headers
skip (type) –
AC1 (type) –
AC2 (type) –
1 2 3 4 5 6 7 8 9 10 11 12 13 14 15 16 17 18 19 20 21 22 23 24 25 26 27 28 29 30 31 32 33 34 35 36 37 38 39 40 41 42 43 44 45 46 47 48 49 50 51 52 53 54 55 56 57 58 59 60 61 62 63 64 65 66 67 68 69 70 71 72 73 74 75 76 77 78 79 80 81 82 83 84 85 86 87 88 89 90 91 92 93 94 95 96 97 98 99 100 101 102 103 104 105 106 107 108 109 110 111 112 113 114 115 116 117 118 119 120 121 122 123 124 125 126 127 128 129 130 131 132 133 134 135 | tb[0][1] = "Baseline";
tb[0][2] = "";
tb[0][3] = "Endline";
tb[0][4] = "";
tb[0][5] = "Impact";
tb[1] = new Array();
tb[1][0] = "";
tb[1][1] = "Sample";
tb[1][2] = "%";
tb[1][3] = "Sample";
tb[1][4] = "%";
tb[1][5] = "%";
for (h = 0; h < clm.length; h++) {
TotalB = totaloutputbl;
TotalE = totaloutputel;
}
var u = 2;
for (iz = 0; iz < clm.length; iz++) {
if (skip != "No" && bl[iz] == 0 && el[iz] == 0) {
continue;
}
var cvalue = clm[iz];
tb[u] = new Array();
tb[u][0] = newclm[iz];
tb[u][1] = bl[iz];
if (TotalB != 0) {
tb[u][2] = bl[iz] / TotalB;
} else {
tb[u][2] = "";
}
tb[u][3] = el[iz];
if (TotalE != 0 && endline != 0) {
tb[u][4] = el[iz] / TotalE;
if (TotalB > 0) { tb[u][5] = el[iz] / TotalE - bl[iz] / TotalB; } else { tb[u][5] = ""; }
} else {
tb[u][4] = "";
tb[u][5] = "";
}
u++;
}
tb[u] = new Array();
tb[u][0] = "TOTAL";
tb[u][1] = TotalB;
if (TotalB != 0) {
tb[u][2] = TotalB / TotalB;
} else {
tb[u][2] = "";
}
tb[u][3] = TotalE;
if (TotalE != 0 && endline != 0) {
tb[u][4] = TotalE / TotalE;
tb[u][5] = "";
} else {
tb[u][4] = "";
tb[u][5] = "";
}
return tb;
}
/**
* The function generates the values for tables [3. SAMPLE SIZE PER OUTPUT > Table " Number of beneficiaries per livelihoods output surveyed" ],[4.1 AGRICULTURAL EMPLOYMENT > Table "% of forcibly displaced targeted who are wage/self employed in the agricultural sector", Table "of forcibly displaced targeted who are wage/self employed on a permanent / monthly / seasonal basis in the agricultural sector",Table "Number of others employed by self-employed beneficiaries"],[4.3 INCOME/SAVING GAINED FROM AGRICULTURE > Core indicators table],[5.1 SELF-EMPLOYMENT > Table "% of forcibly displaced targeted who are self-employed"; Table "% of forcibly displaced targeted who are self-employed in the formal/informal sector", Table "% of forcibly displaced targeted with own business / self-employed for (6/12) months or more"],[5.2 INCOME/SAVING GAINED FROM SELF-EMPLOYMENT > Table " % of forcibly displaced targeted who self-report (decreased/maintained/increased) income compared to previous year" , Table ": % of forcibly displaced targeted who self-report (decreased/maintained/increased) income compared to previous year "]
* @param {array} clm - array of columns
* @param {array} newclm - array of new columns
* @param {array} item - data
* @param {header} header - headers
* @param {type} skip
* @param {type} AC1
* @param {type} AC2
*/
function generateTablePercentIndicatorImpactChange(clm, newclm, item, header, skip, AC1, AC2) {
var tb = [];
var TotalB = 0;
var TotalE = 0;
var bl = new Array();
var el = new Array();
var cc = 1;
var k = 0,
kk = 0;
for (h1 = 0; h1 < clm.length; h1++) {
for (h2 = 0; h2 < clm[h1].length; h2++) {
kk++;
for (h3 = 0; h3 < clm.length; h3++) {
for (h4 = 0; h4 < clm[h3].length; h4++) {
if (clm[h3][h4].indexOf(clm[h1][h2]) > -1) {
k++;
}
}
}
}
}
if (k > kk) {
cc = 0;
}
for (ic = 0; ic < clm.length; ic++) {
bl[ic] = 0;
el[ic] = 0;
}
for (ic = 0; ic < clm.length; ic++) {
for (hh = 0; hh < header.length; hh++) {
bl[ic] = bl[ic] + countNumBenefIndicator(item, header[hh], clm[ic], "Baseline", cc, AC1, AC2);
el[ic] = el[ic] + countNumBenefIndicator(item, header[hh], clm[ic], "Endline", cc, AC1, AC2);
}
}
tb[0] = new Array();
tb[0][0] = "";
tb[0][1] = "Baseline";
tb[0][2] = "";
tb[0][3] = "Endline";
tb[0][4] = "";
if (header[0].indexOf("IncomeSaving") > -1) {
tb[0][5] = "Change";
} else {
tb[0][5] = "Impact";
}
tb[1] = new Array();
tb[1][0] = "";
tb[1][1] = "Sample";
tb[1][2] = "%";
tb[1][3] = "Sample";
tb[1][4] = "%";
tb[1][5] = "%";
for (h = 0; h < clm.length; h++) {
TotalB = TotalB + bl[h];
TotalE = TotalE + el[h];
|
Function generateTableIndicator41AgrEmpl
-
generateTableIndicator41AgrEmpl(clm, newclm, item, header)¶ The function generates the table on Country Abalysis note [4.1 AGRICULTURAL EMPLOYMENT > Table: % of forcibly displaced targeted who are wage/self employed on a permanent / monthly / seasonal basis in the agricultural sector]
- Arguments
clm (array) – array of columns
newclm (array) – array of new columns
item (array) – data
header (header) – headers
1 2 3 4 5 6 7 8 9 10 11 12 13 14 15 16 17 18 19 20 21 22 23 24 25 26 27 28 29 30 31 32 33 34 35 36 37 38 39 40 41 42 43 44 45 46 47 48 49 50 51 52 53 54 55 56 57 58 59 60 61 62 63 64 65 66 67 68 | for (iz = 0; iz < clm.length; iz++) {
if (skip != "No" && bl[iz] == 0 && el[iz] == 0) {
continue;
}
var cvalue = clm[iz];
tb[u] = new Array();
tb[u][0] = newclm[iz];
tb[u][1] = bl[iz];
if (TotalB != 0) {
tb[u][2] = bl[iz] / TotalB;
} else {
tb[u][2] = "";
}
tb[u][3] = el[iz];
if (TotalE != 0 && endline != 0) {
tb[u][4] = el[iz] / TotalE;
if (TotalB > 0) { tb[u][5] = el[iz] / TotalE - bl[iz] / TotalB; } else { tb[u][5] = ""; }
} else {
tb[u][4] = "";
tb[u][5] = "";
}
u++;
}
if (skip == 'x') {
tb[u] = new Array();
tb[u][0] = "No Employment";
tb[u][1] = nob;
if (TotalB != 0) {
tb[u][2] = nob / TotalB;
} else {
tb[u][2] = "";
}
tb[u][3] = noe;
if (TotalE != 0 && endline != 0) {
tb[u][4] = noe / TotalE;
if (TotalB > 0) { tb[u][5] = tb[u][4] - tb[u][2]; } else { tb[u][5] = ""; }
} else {
tb[u][4] = "";
tb[u][5] = "";
}
u++;
}
tb[u] = new Array();
tb[u][0] = "TOTAL";
tb[u][1] = TotalB;
if (TotalB != 0) {
tb[u][2] = TotalB / TotalB;
} else {
tb[u][2] = "";
}
tb[u][3] = TotalE;
if (TotalE != 0 && endline != 0) {
tb[u][4] = TotalE / TotalE;
tb[u][5] = "";
} else {
tb[u][4] = "";
tb[u][5] = "";
}
return tb;
}
/**
* The function generates tables [4.1 AGRICULTURAL EMPLOYMENT > Table " Number of others employed by self-employed beneficiaries" ]
* @param {array} newclm - array of new columns
* @param {array} item - data
|
Function formatTables
-
formatTables(y, x, ttb, title, merge)¶ The function presentes and formats the table [3. SAMPLE SIZE PER OUTPUT >Table 1: Number of beneficiaries per livelihoods output surveyed;], [4. OUTPUT 1: ACCESS TO AGRICULTURE PRODUCTION ENHANCED >Table 2: Sample beneficiaries per agricultural sub-sectors; Table 3: Interventions provided to sample beneficiaries by type ]
- Arguments
y (type) –
x (type) –
ttb (type) –
title (type) –
merge (type) –
1 2 3 4 5 6 7 8 9 10 11 12 13 14 15 16 17 18 19 20 21 22 23 24 25 26 27 28 29 30 31 32 33 34 35 36 37 38 39 40 41 42 | var TotalE = 0;
var cc = 1;
tb[0] = new Array();
tb[0][0] = "";
tb[0][1] = "Baseline";
tb[0][2] = "";
tb[0][3] = "Endline";
tb[0][4] = "";
tb[0][5] = "Impact";
tb[1] = new Array();
tb[1][0] = "";
tb[1][1] = "Sample";
tb[1][2] = "%";
tb[1][3] = "Sample";
tb[1][4] = "%";
tb[1][5] = "#"
for (h = 0; h < header.length; h++) {
TotalB = TotalB + countNumItemsIndicator42Agr(item, header[h], "Baseline", cc, AC1, AC2);
TotalE = TotalE + countNumItemsIndicator42Agr(item, header[h], "Endline", cc, AC1, AC2);
}
var u = 2;
for (iz = 0; iz < header.length; iz++) {
tb[u] = new Array();
tb[u][0] = newclm[iz];
tb[u][1] = countNumItemsIndicator42Agr(item, header[iz], "Baseline", cc, AC1, AC2);
if (TotalB != 0) {
tb[u][2] = countNumItemsIndicator42Agr(item, header[iz], "Baseline", cc, AC1, AC2) / TotalB;
} else {
tb[u][2] = "";
}
tb[u][3] = countNumItemsIndicator42Agr(item, header[iz], "Endline", cc, AC1, AC2);
if (TotalE != 0 && endline != 0) {
tb[u][4] = countNumItemsIndicator42Agr(item, header[iz], "Endline", cc, AC1, AC2) / TotalE;
if (TotalB > 0) { tb[u][5] = tb[u][3] - tb[u][1]; } else { tb[u][5] = ""; }
} else {
tb[u][4] = "";
tb[u][5] = "";
}
|
Function formatText
-
formatText(y, x, z, font, size, color, background, merge, border, halighment, bold)¶ The function formats the text
- Arguments
y (string) – column
x (string) – row
z (string) – the value for the range.
font (string) –
size (string) –
color (string) –
background (string) –
merge (string) –
border (string) –
halighment (string) –
bold (string) –
1 2 3 4 5 6 7 8 9 10 11 12 13 14 15 | sumsheet.getRange(y, x, 1, ttb[0].length).setVerticalAlignment("bottom");
sumsheet.getRange(y + 2, x, ttb.length, 1).setFontWeight("bold");
sumsheet.getRange(y + ttb.length - 1, x, 1, ttb[0].length).setFontWeight("bold");
for (i = 0; i < ttb[0].length; i++) {
if (ttb[1][i] == "%") {
sumsheet.getRange(y, x + i, ttb.length, 1).setNumberFormat('0%;[Red](0%)');
} else {
sumsheet.getRange(y, x + i, ttb.length, 1).setNumberFormat("#,##0_);[Red](#,##0)");
}
}
sumsheet.getRange(y, x + 1, 1, 2).merge();
sumsheet.getRange(y, x + 1).setHorizontalAlignment("Center");
sumsheet.getRange(y, x + 3, 1, 2).merge();
|
Function formatNote
-
formatNote(y, x, text)¶ The function formats the note
- Arguments
y (string) – column
x (string) – row
text (string) –
1 2 3 4 5 6 | * The function FAOAVERAGE was removed [12-10-2019]
*/
}
{ //OTHERS
|
Function takeUniqueDataBGsheet
-
takeUniqueDataBGsheet(c, 0)¶ The function loops through takeUniqueDataBGsheet data from BG sheet [Beneficiary data]
- Arguments
c (number) – column
0 (string) –
1 2 3 4 5 6 7 8 9 10 11 12 13 14 15 16 17 18 | hbene3 = 0;;
var camps;
var cnames = "";
var totalbudget = 0,
totalpoc = 0,
totalhost = 0;
var npartner = 0;
var int1 = "";
var int2 = "";
var int3 = "";
/**
* The function cf() was removed [12-10-2019]
*/
/**
* The function formats the text
*
* @param {string} y - column
|
Function formatGraphArrow
-
formatGraphArrow(y, x, i, s, d, is)¶ The function helps to format the graph chart
- Arguments
y (string) – column
x (string) – row
i (string) – not used
s (string) – not used
d (string) – not used
is (string) – not used
1 2 3 4 5 6 7 8 9 10 11 12 13 | rng.setValue(z);
rng.setFontFamily(font);
rng.setFontSize(size);
rng.setFontColor(color);
rng.setBackground(background);
rng.setHorizontalAlignment(halighnment);
if (bold == "bold") {
rng.setFontWeight("bold");
} else { rng.setFontWeight("normal"); }
rng.setWrap(true);
sumsheet.getRange(y, x, 1, merge).merge();
rng.setBorder(true, true, true, true, true, true, border, SpreadsheetApp.BorderStyle.SOLID);
}
|
Function formatHeader
-
formatHeader(header, M)¶ The function formats the header
- Arguments
header (string) –
M (string) –
1 2 3 4 5 6 7 8 9 10 11 12 13 14 15 16 17 18 19 20 | * @param {string} y - column
* @param {string} x - row
* @param {string} text
*/
function formatNote(y, x, text) {
sumsheet.getRange(y, x).setValue(text);
sumsheet.getRange(y, x).setFontSize(9);
sumsheet.getRange(y, x).setFontColor("grey");
sumsheet.getRange(y, x).setHorizontalAlignment("right");
}
/*The function layout() was removed [12-10-2019] */
/**
* The function loops through takeUniqueDataBGsheet data from BG sheet [Beneficiary data]
* @param {number} c - column
* @param {string} 0
|
Function generateTemplateDataSpCountry
-
generateTemplateDataSpCountry(Partnerx, country)¶ The function takes the template data for specific country
- Arguments
Partnerx (string) – partner name
country (string) – country name
1 2 3 4 5 6 7 8 9 10 11 12 13 14 15 16 17 18 19 20 21 22 23 24 25 26 27 28 29 30 31 32 33 34 35 36 37 38 39 40 41 42 43 44 45 46 47 48 49 50 51 52 53 54 55 56 57 58 59 60 61 62 63 64 65 66 67 68 69 70 71 72 73 74 75 76 77 78 79 80 81 82 83 84 85 86 87 88 89 90 91 92 93 94 95 96 97 98 99 100 101 102 103 104 105 106 107 108 109 110 111 112 113 114 115 116 117 118 119 120 121 122 123 124 125 126 127 128 129 130 131 132 133 134 135 136 137 138 139 140 141 142 143 144 145 146 147 148 149 150 151 152 153 154 155 156 157 158 159 160 161 162 163 164 165 166 167 168 169 170 171 172 173 174 175 176 177 178 179 180 181 182 183 184 185 186 187 188 189 190 191 192 193 194 195 196 197 198 199 200 201 202 203 204 205 206 207 208 209 210 211 212 213 214 215 216 217 218 219 220 221 222 223 224 225 226 227 228 229 230 231 232 233 234 235 236 237 238 239 240 241 242 243 244 245 246 247 248 249 250 251 252 253 254 255 256 257 258 259 260 261 262 263 264 265 266 267 268 269 270 271 272 273 274 275 276 277 278 279 280 281 282 283 284 285 286 287 288 289 290 291 292 293 294 295 296 297 298 299 300 301 302 303 304 305 306 307 308 309 310 311 312 313 314 315 316 317 318 319 320 321 322 323 324 325 326 327 328 329 | continue;
}
if (o == "0" && bgdata[i][c - 1] == "Other") {
continue;
}
result++;
}
return result;
}
/*The function takeUniqueDataBGsheetp() was removed [12-10-2019] */
/**
*The function helps to format the graph chart
*
* @param {string} y - column
* @param {string} x - row
* @param {string} i - not used
* @param {string} s - not used
* @param {string} d - not used
* @param {string} is - not used
*/
function formatGraphArrow(y, x, i, s, d, is) {
formatText(y + 1, x, "", "Arial", 11, "navy", "White", 3, "White", "middle", "0")
sumsheet.getRange(y + 1, x).setFormula('=image("https://docs.google.com/uc?export=download&id=1ktPXNPMdhj7NvHlJma52xVq_eAl5v-MN",2)');
formatText(y + 2, x + 1, Math.round(i * 100) + "%", "Arial", Math.round(10 + i * 10 * 1.5), "White", "#ff9900", 1, "#ff9900", "center", "0")
formatText(y + 2, x + 2, is + " increase", "Arial", 9, "Grey", "White", 1, "White", "left", "0")
formatText(y + 3, x + 1, Math.round(s * 100) + "%", "Arial", Math.round(10 + s * 10 * 1.5), "Black", "#cfe2f3", 1, "#cfe2f3", "center", "0")
formatText(y + 3, x + 2, "no change", "Arial", 9, "Grey", "White", 1, "White", "left", "0")
formatText(y + 4, x + 1, Math.round(d * 100) + "%", "Arial", Math.round(10 + d * 10 * 1.5), "White", "#073763", 1, "#073763", "center", "0")
formatText(y + 4, x + 2, is + " decrease", "Arial", 9, "Grey", "White", 1, "White", "left", "0")
formatText(y + 5, x, "", "Arial", 11, "navy", "White", 3, "White", "middle", "0")
sumsheet.getRange(y + 5, x).setFormula('=image("https://docs.google.com/uc?export=download&id=0B0wG4flLsGgvOEZzQnJIUXRUbFk",2)');
}
/**
* The function formats the header
* @param {string} header
* @param {string} M
*/
function formatHeader(header, M) {
var textp = "";
var cccc = 0;
for (i = 0; i < jsonTemplate.length; i++) {
if (Country2 == jsonTemplate[i]['CONTACT_INFORMATION/Country'] && jsonTemplate[i]['PROGRAMME_SYNOPSIS/PROGRAMME_INFORMATION/Year'] == Year) {
if (Dstation != "" && jsonTemplate[i]['CONTACT_INFORMATION/D_Station'] != Dstation) {
continue;
}
if (cccc == 0) {
textp = textp + jsonTemplate[i][header];
cccc++;
} else if (M == "Multi") {
textp = textp + " and " + jsonTemplate[i][header];
}
} else {
continue;
}
}
return textp;
}
/*The function L2() was removed [12-10-2019] */
/*The function ALL() was removed [12-10-2019] */
/**
* The function takes the template data for specific country
* @param {string} Partnerx - partner name
* @param {string} country - country name
*/
function generateTemplateDataSpCountry(Partnerx, country) {
var emp1 = 0;
var emp2 = 0;
var emp3 = 0;
pocbene1 = 0;
pocbene2 = 0;
pocbene3 = 0;
hbene1 = 0;
hbene2 = 0;
hbene3 = 0;
var clist = [];
var ff = 0;
for (f = 0; f < jsonTemplate.length; f++) {
if (country == jsonTemplate[f]['CONTACT_INFORMATION/Country'] && jsonTemplate[f]['PROGRAMME_SYNOPSIS/PROGRAMME_INFORMATION/Year'] == Year) {
if (Dstation != "" && jsonTemplate[f]['CONTACT_INFORMATION/D_Station'] != Dstation) {
continue;
}
if (jsonTemplate[f]['VERSION'] == null) {
npartner = parseInt(jsonTemplate[f]['PROGRAMME_SYNOPSIS/PROGRAMME_INFORMATION/N_Partner']);
totalbudget = /* totalbudget + */ parseInt(jsonTemplate[f]['PROGRAMME_SYNOPSIS/PROGRAMME_INFORMATION/Objective_Budget']);
totalpoc = /* totalpoc + */parseInt(jsonTemplate[f]['PROGRAMME_SYNOPSIS/PROGRAMME_INFORMATION/Population']);
totalhost = /* totalhost + */ parseInt(jsonTemplate[f]['PROGRAMME_SYNOPSIS/PROGRAMME_INFORMATION/Host_Population']);
} else {
npartner = jsonTemplate[f]['PROGRAMME_SYNOPSIS/PROJECT_INFORMATION/Partner'].length;
totalbudget = /* totalbudget + */ parseInt(jsonTemplate[f]['PROGRAMME_SYNOPSIS/PROGRAMME_INFORMATION/Objective_Budget']);
totalpoc = /* totalpoc + */parseInt(jsonTemplate[f]['PROBLEM_STATEMENT/BENEFICIARYPROFILE/v_poc']);
totalhost = /* totalhost + */ parseInt(jsonTemplate[f]['PROBLEM_STATEMENT/BENEFICIARYPROFILE/v_host']);
}
for (p = 0; p < jsonTemplate[f]['PROGRAMME_SYNOPSIS/PROJECT_INFORMATION/Partner'].length; p++) {
if (Partnerx != "ALL" && String(gg(jsonTemplate[f]['PROGRAMME_SYNOPSIS/PROJECT_INFORMATION/Partner'][p]['PROGRAMME_SYNOPSIS/PROJECT_INFORMATION/Partner/PARTNER_INFORMATION/Partner_Name']).replace(/_/g, "").replace(/\s/g, "")) != gg(Partnerx).replace(/_/g, "").replace(/\s/g, "").toUpperCase()) {
continue;
}
if (jsonTemplate[f]['PROGRAMME_SYNOPSIS/PROJECT_INFORMATION/Partner'][p]['PROGRAMME_SYNOPSIS/PROJECT_INFORMATION/Partner/PARTNER_INFORMATION/PO1_Intervention_budget'] != null) {
pbudget = pbudget + parseInt(jsonTemplate[f]['PROGRAMME_SYNOPSIS/PROJECT_INFORMATION/Partner'][p]['PROGRAMME_SYNOPSIS/PROJECT_INFORMATION/Partner/PARTNER_INFORMATION/PO1_Intervention_budget']);
}
if (jsonTemplate[f]['PROGRAMME_SYNOPSIS/PROJECT_INFORMATION/Partner'][p]['PROGRAMME_SYNOPSIS/PROJECT_INFORMATION/Partner/PARTNER_INFORMATION/PO2_Intervention_budget'] != null) {
pbudget = pbudget + parseInt(jsonTemplate[f]['PROGRAMME_SYNOPSIS/PROJECT_INFORMATION/Partner'][p]['PROGRAMME_SYNOPSIS/PROJECT_INFORMATION/Partner/PARTNER_INFORMATION/PO2_Intervention_budget']);
}
if (jsonTemplate[f]['PROGRAMME_SYNOPSIS/PROJECT_INFORMATION/Partner'][p]['PROGRAMME_SYNOPSIS/PROJECT_INFORMATION/Partner/PARTNER_INFORMATION/PO3_Intervention_budget'] != null) {
pbudget = pbudget + parseInt(jsonTemplate[f]['PROGRAMME_SYNOPSIS/PROJECT_INFORMATION/Partner'][p]['PROGRAMME_SYNOPSIS/PROJECT_INFORMATION/Partner/PARTNER_INFORMATION/PO3_Intervention_budget']);
}
//testing
//PoC BENEFICIARY
if (jsonTemplate[f]['VERSION'] == null) {
if (jsonTemplate[f]['PROGRAMME_SYNOPSIS/PROJECT_INFORMATION/Partner'][p]['PROGRAMME_SYNOPSIS/PROJECT_INFORMATION/Partner/PARTNER_INFORMATION/PO1_HA_beneficiaries'] != null) {
if (pocbene1 < parseInt(jsonTemplate[f]['PROGRAMME_SYNOPSIS/PROJECT_INFORMATION/Partner'][p]['PROGRAMME_SYNOPSIS/PROJECT_INFORMATION/Partner/PARTNER_INFORMATION/PO1_HA_beneficiaries'])) {
pocbene1 = pocbene1 + parseInt(jsonTemplate[f]['PROGRAMME_SYNOPSIS/PROJECT_INFORMATION/Partner'][p]['PROGRAMME_SYNOPSIS/PROJECT_INFORMATION/Partner/PARTNER_INFORMATION/PO1_HA_beneficiaries'])
};
}
if (jsonTemplate[f]['PROGRAMME_SYNOPSIS/PROJECT_INFORMATION/Partner'][p]['PROGRAMME_SYNOPSIS/PROJECT_INFORMATION/Partner/PARTNER_INFORMATION/PO1_SA_beneficiaries'] != null) {
if (pocbene1 < parseInt(jsonTemplate[f]['PROGRAMME_SYNOPSIS/PROJECT_INFORMATION/Partner'][p]['PROGRAMME_SYNOPSIS/PROJECT_INFORMATION/Partner/PARTNER_INFORMATION/PO1_SA_beneficiaries'])) {
pocbene1 = pocbene1 + parseInt(jsonTemplate[f]['PROGRAMME_SYNOPSIS/PROJECT_INFORMATION/Partner'][p]['PROGRAMME_SYNOPSIS/PROJECT_INFORMATION/Partner/PARTNER_INFORMATION/PO1_SA_beneficiaries'])
};
}
if (jsonTemplate[f]['PROGRAMME_SYNOPSIS/PROJECT_INFORMATION/Partner'][p]['PROGRAMME_SYNOPSIS/PROJECT_INFORMATION/Partner/PARTNER_INFORMATION/PO1_FPA_beneficiaries'] != null) {
if (pocbene1 < parseInt(jsonTemplate[f]['PROGRAMME_SYNOPSIS/PROJECT_INFORMATION/Partner'][p]['PROGRAMME_SYNOPSIS/PROJECT_INFORMATION/Partner/PARTNER_INFORMATION/PO1_FPA_beneficiaries'])) {
pocbene1 = pocbene1 + parseInt(jsonTemplate[f]['PROGRAMME_SYNOPSIS/PROJECT_INFORMATION/Partner'][p]['PROGRAMME_SYNOPSIS/PROJECT_INFORMATION/Partner/PARTNER_INFORMATION/PO1_FPA_beneficiaries'])
};
}
if (jsonTemplate[f]['PROGRAMME_SYNOPSIS/PROJECT_INFORMATION/Partner'][p]['PROGRAMME_SYNOPSIS/PROJECT_INFORMATION/Partner/PARTNER_INFORMATION/PO1_FA_beneficiaries'] != null) {
if (pocbene1 < parseInt(jsonTemplate[f]['PROGRAMME_SYNOPSIS/PROJECT_INFORMATION/Partner'][p]['PROGRAMME_SYNOPSIS/PROJECT_INFORMATION/Partner/PARTNER_INFORMATION/PO1_FA_beneficiaries'])) {
pocbene1 = pocbene1 + parseInt(jsonTemplate[f]['PROGRAMME_SYNOPSIS/PROJECT_INFORMATION/Partner'][p]['PROGRAMME_SYNOPSIS/PROJECT_INFORMATION/Partner/PARTNER_INFORMATION/PO1_FA_beneficiaries'])
};
}
if (jsonTemplate[f]['PROGRAMME_SYNOPSIS/PROJECT_INFORMATION/Partner'][p]['PROGRAMME_SYNOPSIS/PROJECT_INFORMATION/Partner/PARTNER_INFORMATION/PO1_MPPA_beneficiaries'] != null) {
if (pocbene1 < parseInt(jsonTemplate[f]['PROGRAMME_SYNOPSIS/PROJECT_INFORMATION/Partner'][p]['PROGRAMME_SYNOPSIS/PROJECT_INFORMATION/Partner/PARTNER_INFORMATION/PO1_MPPA_beneficiaries'])) {
pocbene1 = pocbene1 + parseInt(jsonTemplate[f]['PROGRAMME_SYNOPSIS/PROJECT_INFORMATION/Partner'][p]['PROGRAMME_SYNOPSIS/PROJECT_INFORMATION/Partner/PARTNER_INFORMATION/PO1_MPPA_beneficiaries'])
};
}
if (jsonTemplate[f]['PROGRAMME_SYNOPSIS/PROJECT_INFORMATION/Partner'][p]['PROGRAMME_SYNOPSIS/PROJECT_INFORMATION/Partner/PARTNER_INFORMATION/PO1_MA_beneficiaries'] != null) {
if (pocbene1 < parseInt(jsonTemplate[f]['PROGRAMME_SYNOPSIS/PROJECT_INFORMATION/Partner'][p]['PROGRAMME_SYNOPSIS/PROJECT_INFORMATION/Partner/PARTNER_INFORMATION/PO1_MA_beneficiaries'])) {
pocbene1 = pocbene1 + parseInt(jsonTemplate[f]['PROGRAMME_SYNOPSIS/PROJECT_INFORMATION/Partner'][p]['PROGRAMME_SYNOPSIS/PROJECT_INFORMATION/Partner/PARTNER_INFORMATION/PO1_MA_beneficiaries'])
};
}
if (jsonTemplate[f]['PROGRAMME_SYNOPSIS/PROJECT_INFORMATION/Partner'][p]['PROGRAMME_SYNOPSIS/PROJECT_INFORMATION/Partner/PARTNER_INFORMATION/PO1_PD_beneficiaries'] != null) {
if (pocbene1 < parseInt(jsonTemplate[f]['PROGRAMME_SYNOPSIS/PROJECT_INFORMATION/Partner'][p]['PROGRAMME_SYNOPSIS/PROJECT_INFORMATION/Partner/PARTNER_INFORMATION/PO1_PD_beneficiaries'])) {
pocbene1 = pocbene1 + parseInt(jsonTemplate[f]['PROGRAMME_SYNOPSIS/PROJECT_INFORMATION/Partner'][p]['PROGRAMME_SYNOPSIS/PROJECT_INFORMATION/Partner/PARTNER_INFORMATION/PO1_PD_beneficiaries'])
};
}
if (jsonTemplate[f]['PROGRAMME_SYNOPSIS/PROJECT_INFORMATION/Partner'][p]['PROGRAMME_SYNOPSIS/PROJECT_INFORMATION/Partner/PARTNER_INFORMATION/PO1_EMP_beneficiaries'] != null) {
if (pocbene1 < parseInt(jsonTemplate[f]['PROGRAMME_SYNOPSIS/PROJECT_INFORMATION/Partner'][p]['PROGRAMME_SYNOPSIS/PROJECT_INFORMATION/Partner/PARTNER_INFORMATION/PO1_EMP_beneficiaries'])) {
pocbene1 = pocbene1 + parseInt(jsonTemplate[f]['PROGRAMME_SYNOPSIS/PROJECT_INFORMATION/Partner'][p]['PROGRAMME_SYNOPSIS/PROJECT_INFORMATION/Partner/PARTNER_INFORMATION/PO1_EMP_beneficiaries'])
};
}
if (jsonTemplate[f]['PROGRAMME_SYNOPSIS/PROJECT_INFORMATION/Partner'][p]['PROGRAMME_SYNOPSIS/PROJECT_INFORMATION/Partner/PARTNER_INFORMATION/PO2_HA_beneficiaries'] != null) {
if (pocbene2 < parseInt(jsonTemplate[f]['PROGRAMME_SYNOPSIS/PROJECT_INFORMATION/Partner'][p]['PROGRAMME_SYNOPSIS/PROJECT_INFORMATION/Partner/PARTNER_INFORMATION/PO2_HA_beneficiaries'])) {
pocbene2 = parseInt(jsonTemplate[f]['PROGRAMME_SYNOPSIS/PROJECT_INFORMATION/Partner'][p]['PROGRAMME_SYNOPSIS/PROJECT_INFORMATION/Partner/PARTNER_INFORMATION/PO2_HA_beneficiaries'])
};
}
if (jsonTemplate[f]['PROGRAMME_SYNOPSIS/PROJECT_INFORMATION/Partner'][p]['PROGRAMME_SYNOPSIS/PROJECT_INFORMATION/Partner/PARTNER_INFORMATION/PO2_SA_beneficiaries'] != null) {
if (pocbene2 < parseInt(jsonTemplate[f]['PROGRAMME_SYNOPSIS/PROJECT_INFORMATION/Partner'][p]['PROGRAMME_SYNOPSIS/PROJECT_INFORMATION/Partner/PARTNER_INFORMATION/PO2_SA_beneficiaries'])) {
pocbene2 = parseInt(jsonTemplate[f]['PROGRAMME_SYNOPSIS/PROJECT_INFORMATION/Partner'][p]['PROGRAMME_SYNOPSIS/PROJECT_INFORMATION/Partner/PARTNER_INFORMATION/PO2_SA_beneficiaries'])
};
}
if (jsonTemplate[f]['PROGRAMME_SYNOPSIS/PROJECT_INFORMATION/Partner'][p]['PROGRAMME_SYNOPSIS/PROJECT_INFORMATION/Partner/PARTNER_INFORMATION/PO2_FPA_beneficiaries'] != null) {
if (pocbene2 < parseInt(jsonTemplate[f]['PROGRAMME_SYNOPSIS/PROJECT_INFORMATION/Partner'][p]['PROGRAMME_SYNOPSIS/PROJECT_INFORMATION/Partner/PARTNER_INFORMATION/PO2_FPA_beneficiaries'])) {
pocbene2 = parseInt(jsonTemplate[f]['PROGRAMME_SYNOPSIS/PROJECT_INFORMATION/Partner'][p]['PROGRAMME_SYNOPSIS/PROJECT_INFORMATION/Partner/PARTNER_INFORMATION/PO2_FPA_beneficiaries'])
};
}
if (jsonTemplate[f]['PROGRAMME_SYNOPSIS/PROJECT_INFORMATION/Partner'][p]['PROGRAMME_SYNOPSIS/PROJECT_INFORMATION/Partner/PARTNER_INFORMATION/PO2_FA_beneficiaries'] != null) {
if (pocbene2 < parseInt(jsonTemplate[f]['PROGRAMME_SYNOPSIS/PROJECT_INFORMATION/Partner'][p]['PROGRAMME_SYNOPSIS/PROJECT_INFORMATION/Partner/PARTNER_INFORMATION/PO2_FA_beneficiaries'])) {
pocbene2 = parseInt(jsonTemplate[f]['PROGRAMME_SYNOPSIS/PROJECT_INFORMATION/Partner'][p]['PROGRAMME_SYNOPSIS/PROJECT_INFORMATION/Partner/PARTNER_INFORMATION/PO2_FA_beneficiaries'])
};
}
if (jsonTemplate[f]['PROGRAMME_SYNOPSIS/PROJECT_INFORMATION/Partner'][p]['PROGRAMME_SYNOPSIS/PROJECT_INFORMATION/Partner/PARTNER_INFORMATION/PO2_MPPA_beneficiaries'] != null) {
if (pocbene2 < parseInt(jsonTemplate[f]['PROGRAMME_SYNOPSIS/PROJECT_INFORMATION/Partner'][p]['PROGRAMME_SYNOPSIS/PROJECT_INFORMATION/Partner/PARTNER_INFORMATION/PO2_MPPA_beneficiaries'])) {
pocbene2 = parseInt(jsonTemplate[f]['PROGRAMME_SYNOPSIS/PROJECT_INFORMATION/Partner'][p]['PROGRAMME_SYNOPSIS/PROJECT_INFORMATION/Partner/PARTNER_INFORMATION/PO2_MPPA_beneficiaries'])
};
}
if (jsonTemplate[f]['PROGRAMME_SYNOPSIS/PROJECT_INFORMATION/Partner'][p]['PROGRAMME_SYNOPSIS/PROJECT_INFORMATION/Partner/PARTNER_INFORMATION/PO2_MA_beneficiaries'] != null) {
if (pocbene2 < parseInt(jsonTemplate[f]['PROGRAMME_SYNOPSIS/PROJECT_INFORMATION/Partner'][p]['PROGRAMME_SYNOPSIS/PROJECT_INFORMATION/Partner/PARTNER_INFORMATION/PO2_MA_beneficiaries'])) {
pocbene2 = parseInt(jsonTemplate[f]['PROGRAMME_SYNOPSIS/PROJECT_INFORMATION/Partner'][p]['PROGRAMME_SYNOPSIS/PROJECT_INFORMATION/Partner/PARTNER_INFORMATION/PO2_MA_beneficiaries'])
};
}
if (jsonTemplate[f]['PROGRAMME_SYNOPSIS/PROJECT_INFORMATION/Partner'][p]['PROGRAMME_SYNOPSIS/PROJECT_INFORMATION/Partner/PARTNER_INFORMATION/PO2_EMP_beneficiaries'] != null) {
if (pocbene2 < parseInt(jsonTemplate[f]['PROGRAMME_SYNOPSIS/PROJECT_INFORMATION/Partner'][p]['PROGRAMME_SYNOPSIS/PROJECT_INFORMATION/Partner/PARTNER_INFORMATION/PO2_EMP_beneficiaries'])) {
pocbene2 = parseInt(jsonTemplate[f]['PROGRAMME_SYNOPSIS/PROJECT_INFORMATION/Partner'][p]['PROGRAMME_SYNOPSIS/PROJECT_INFORMATION/Partner/PARTNER_INFORMATION/PO2_EMP_beneficiaries'])
};
}
if (jsonTemplate[f]['PROGRAMME_SYNOPSIS/PROJECT_INFORMATION/Partner'][p]['PROGRAMME_SYNOPSIS/PROJECT_INFORMATION/Partner/PARTNER_INFORMATION/PO3_HA_beneficiaries'] != null) {
if (pocbene3 < parseInt(jsonTemplate[f]['PROGRAMME_SYNOPSIS/PROJECT_INFORMATION/Partner'][p]['PROGRAMME_SYNOPSIS/PROJECT_INFORMATION/Partner/PARTNER_INFORMATION/PO3_HA_beneficiaries'])) {
pocbene3 = parseInt(jsonTemplate[f]['PROGRAMME_SYNOPSIS/PROJECT_INFORMATION/Partner'][p]['PROGRAMME_SYNOPSIS/PROJECT_INFORMATION/Partner/PARTNER_INFORMATION/PO3_HA_beneficiaries'])
};
}
if (jsonTemplate[f]['PROGRAMME_SYNOPSIS/PROJECT_INFORMATION/Partner'][p]['PROGRAMME_SYNOPSIS/PROJECT_INFORMATION/Partner/PARTNER_INFORMATION/PO3_SA_beneficiaries'] != null) {
if (pocbene3 < parseInt(jsonTemplate[f]['PROGRAMME_SYNOPSIS/PROJECT_INFORMATION/Partner'][p]['PROGRAMME_SYNOPSIS/PROJECT_INFORMATION/Partner/PARTNER_INFORMATION/PO3_SA_beneficiaries'])) {
pocbene3 = parseInt(jsonTemplate[f]['PROGRAMME_SYNOPSIS/PROJECT_INFORMATION/Partner'][p]['PROGRAMME_SYNOPSIS/PROJECT_INFORMATION/Partner/PARTNER_INFORMATION/PO3_SA_beneficiaries'])
};
}
if (jsonTemplate[f]['PROGRAMME_SYNOPSIS/PROJECT_INFORMATION/Partner'][p]['PROGRAMME_SYNOPSIS/PROJECT_INFORMATION/Partner/PARTNER_INFORMATION/PO3_FPA_beneficiaries'] != null) {
if (pocbene3 < parseInt(jsonTemplate[f]['PROGRAMME_SYNOPSIS/PROJECT_INFORMATION/Partner'][p]['PROGRAMME_SYNOPSIS/PROJECT_INFORMATION/Partner/PARTNER_INFORMATION/PO3_FPA_beneficiaries'])) {
pocbene3 = parseInt(jsonTemplate[f]['PROGRAMME_SYNOPSIS/PROJECT_INFORMATION/Partner'][p]['PROGRAMME_SYNOPSIS/PROJECT_INFORMATION/Partner/PARTNER_INFORMATION/PO3_FPA_beneficiaries'])
};
}
if (jsonTemplate[f]['PROGRAMME_SYNOPSIS/PROJECT_INFORMATION/Partner'][p]['PROGRAMME_SYNOPSIS/PROJECT_INFORMATION/Partner/PARTNER_INFORMATION/PO3_FA_beneficiaries'] != null) {
if (pocbene3 < parseInt(jsonTemplate[f]['PROGRAMME_SYNOPSIS/PROJECT_INFORMATION/Partner'][p]['PROGRAMME_SYNOPSIS/PROJECT_INFORMATION/Partner/PARTNER_INFORMATION/PO3_FA_beneficiaries'])) {
pocbene3 = parseInt(jsonTemplate[f]['PROGRAMME_SYNOPSIS/PROJECT_INFORMATION/Partner'][p]['PROGRAMME_SYNOPSIS/PROJECT_INFORMATION/Partner/PARTNER_INFORMATION/PO3_FA_beneficiaries'])
};
}
if (jsonTemplate[f]['PROGRAMME_SYNOPSIS/PROJECT_INFORMATION/Partner'][p]['PROGRAMME_SYNOPSIS/PROJECT_INFORMATION/Partner/PARTNER_INFORMATION/PO3_EMP_beneficiaries'] != null) {
if (pocbene3 < parseInt(jsonTemplate[f]['PROGRAMME_SYNOPSIS/PROJECT_INFORMATION/Partner'][p]['PROGRAMME_SYNOPSIS/PROJECT_INFORMATION/Partner/PARTNER_INFORMATION/PO3_EMP_beneficiaries'])) {
pocbene3 = parseInt(jsonTemplate[f]['PROGRAMME_SYNOPSIS/PROJECT_INFORMATION/Partner'][p]['PROGRAMME_SYNOPSIS/PROJECT_INFORMATION/Partner/PARTNER_INFORMATION/PO3_EMP_beneficiaries'])
};
}
} else {
if (jsonTemplate[f]['PROGRAMME_SYNOPSIS/PROJECT_INFORMATION/Partner'][p]['PROGRAMME_SYNOPSIS/PROJECT_INFORMATION/Partner/PARTNER_INFORMATION/PO1_beneficiaries'] != null) {
pocbene1 = pocbene1 + parseInt(jsonTemplate[f]['PROGRAMME_SYNOPSIS/PROJECT_INFORMATION/Partner'][p]['PROGRAMME_SYNOPSIS/PROJECT_INFORMATION/Partner/PARTNER_INFORMATION/PO1_beneficiaries']);
}
if (jsonTemplate[f]['PROGRAMME_SYNOPSIS/PROJECT_INFORMATION/Partner'][p]['PROGRAMME_SYNOPSIS/PROJECT_INFORMATION/Partner/PARTNER_INFORMATION/PO2_beneficiaries'] != null) {
pocbene2 = parseInt(jsonTemplate[f]['PROGRAMME_SYNOPSIS/PROJECT_INFORMATION/Partner'][p]['PROGRAMME_SYNOPSIS/PROJECT_INFORMATION/Partner/PARTNER_INFORMATION/PO2_beneficiaries']);
}
if (jsonTemplate[f]['PROGRAMME_SYNOPSIS/PROJECT_INFORMATION/Partner'][p]['PROGRAMME_SYNOPSIS/PROJECT_INFORMATION/Partner/PARTNER_INFORMATION/PO3_beneficiaries'] != null) {
pocbene3 = parseInt(jsonTemplate[f]['PROGRAMME_SYNOPSIS/PROJECT_INFORMATION/Partner'][p]['PROGRAMME_SYNOPSIS/PROJECT_INFORMATION/Partner/PARTNER_INFORMATION/PO3_beneficiaries']);
}
}
//HOST BENEFICIARY
if (jsonTemplate[f]['VERSION'] == null) {
if (jsonTemplate[f]['PROGRAMME_SYNOPSIS/PROJECT_INFORMATION/Partner'][p]['PROGRAMME_SYNOPSIS/PROJECT_INFORMATION/Partner/PARTNER_INFORMATION/PO1_HA_hbeneficiaries'] != null) {
if (hbene1 < parseInt(jsonTemplate[f]['PROGRAMME_SYNOPSIS/PROJECT_INFORMATION/Partner'][p]['PROGRAMME_SYNOPSIS/PROJECT_INFORMATION/Partner/PARTNER_INFORMATION/PO1_HA_hbeneficiaries'])) {
hbene1 = parseInt(jsonTemplate[f]['PROGRAMME_SYNOPSIS/PROJECT_INFORMATION/Partner'][p]['PROGRAMME_SYNOPSIS/PROJECT_INFORMATION/Partner/PARTNER_INFORMATION/PO1_HA_hbeneficiaries'])
};
}
if (jsonTemplate[f]['PROGRAMME_SYNOPSIS/PROJECT_INFORMATION/Partner'][p]['PROGRAMME_SYNOPSIS/PROJECT_INFORMATION/Partner/PARTNER_INFORMATION/PO1_SA_hbeneficiaries'] != null) {
if (hbene1 < parseInt(jsonTemplate[f]['PROGRAMME_SYNOPSIS/PROJECT_INFORMATION/Partner'][p]['PROGRAMME_SYNOPSIS/PROJECT_INFORMATION/Partner/PARTNER_INFORMATION/PO1_SA_hbeneficiaries'])) {
hbene1 = parseInt(jsonTemplate[f]['PROGRAMME_SYNOPSIS/PROJECT_INFORMATION/Partner'][p]['PROGRAMME_SYNOPSIS/PROJECT_INFORMATION/Partner/PARTNER_INFORMATION/PO1_SA_hbeneficiaries'])
};
}
if (jsonTemplate[f]['PROGRAMME_SYNOPSIS/PROJECT_INFORMATION/Partner'][p]['PROGRAMME_SYNOPSIS/PROJECT_INFORMATION/Partner/PARTNER_INFORMATION/PO1_FPA_hbeneficiaries'] != null) {
if (hbene1 < parseInt(jsonTemplate[f]['PROGRAMME_SYNOPSIS/PROJECT_INFORMATION/Partner'][p]['PROGRAMME_SYNOPSIS/PROJECT_INFORMATION/Partner/PARTNER_INFORMATION/PO1_FPA_hbeneficiaries'])) {
hbene1 = parseInt(jsonTemplate[f]['PROGRAMME_SYNOPSIS/PROJECT_INFORMATION/Partner'][p]['PROGRAMME_SYNOPSIS/PROJECT_INFORMATION/Partner/PARTNER_INFORMATION/PO1_FPA_hbeneficiaries'])
};
}
if (jsonTemplate[f]['PROGRAMME_SYNOPSIS/PROJECT_INFORMATION/Partner'][p]['PROGRAMME_SYNOPSIS/PROJECT_INFORMATION/Partner/PARTNER_INFORMATION/PO1_FA_hbeneficiaries'] != null) {
if (hbene1 < parseInt(jsonTemplate[f]['PROGRAMME_SYNOPSIS/PROJECT_INFORMATION/Partner'][p]['PROGRAMME_SYNOPSIS/PROJECT_INFORMATION/Partner/PARTNER_INFORMATION/PO1_FA_hbeneficiaries'])) {
hbene1 = parseInt(jsonTemplate[f]['PROGRAMME_SYNOPSIS/PROJECT_INFORMATION/Partner'][p]['PROGRAMME_SYNOPSIS/PROJECT_INFORMATION/Partner/PARTNER_INFORMATION/PO1_FA_hbeneficiaries'])
};
}
if (jsonTemplate[f]['PROGRAMME_SYNOPSIS/PROJECT_INFORMATION/Partner'][p]['PROGRAMME_SYNOPSIS/PROJECT_INFORMATION/Partner/PARTNER_INFORMATION/PO1_MPPA_hbeneficiaries'] != null) {
if (hbene1 < parseInt(jsonTemplate[f]['PROGRAMME_SYNOPSIS/PROJECT_INFORMATION/Partner'][p]['PROGRAMME_SYNOPSIS/PROJECT_INFORMATION/Partner/PARTNER_INFORMATION/PO1_MPPA_hbeneficiaries'])) {
hbene1 = parseInt(jsonTemplate[f]['PROGRAMME_SYNOPSIS/PROJECT_INFORMATION/Partner'][p]['PROGRAMME_SYNOPSIS/PROJECT_INFORMATION/Partner/PARTNER_INFORMATION/PO1_MPPA_hbeneficiaries'])
};
}
if (jsonTemplate[f]['PROGRAMME_SYNOPSIS/PROJECT_INFORMATION/Partner'][p]['PROGRAMME_SYNOPSIS/PROJECT_INFORMATION/Partner/PARTNER_INFORMATION/PO1_MA_hbeneficiaries'] != null) {
if (hbene1 < parseInt(jsonTemplate[f]['PROGRAMME_SYNOPSIS/PROJECT_INFORMATION/Partner'][p]['PROGRAMME_SYNOPSIS/PROJECT_INFORMATION/Partner/PARTNER_INFORMATION/PO1_MA_hbeneficiaries'])) {
hbene1 = parseInt(jsonTemplate[f]['PROGRAMME_SYNOPSIS/PROJECT_INFORMATION/Partner'][p]['PROGRAMME_SYNOPSIS/PROJECT_INFORMATION/Partner/PARTNER_INFORMATION/PO1_MA_hbeneficiaries'])
};
}
if (jsonTemplate[f]['PROGRAMME_SYNOPSIS/PROJECT_INFORMATION/Partner'][p]['PROGRAMME_SYNOPSIS/PROJECT_INFORMATION/Partner/PARTNER_INFORMATION/PO1_PD_hbeneficiaries'] != null) {
if (hbene1 < parseInt(jsonTemplate[f]['PROGRAMME_SYNOPSIS/PROJECT_INFORMATION/Partner'][p]['PROGRAMME_SYNOPSIS/PROJECT_INFORMATION/Partner/PARTNER_INFORMATION/PO1_PD_hbeneficiaries'])) {
hbene1 = parseInt(jsonTemplate[f]['PROGRAMME_SYNOPSIS/PROJECT_INFORMATION/Partner'][p]['PROGRAMME_SYNOPSIS/PROJECT_INFORMATION/Partner/PARTNER_INFORMATION/PO1_PD_hbeneficiaries'])
};
}
if (jsonTemplate[f]['PROGRAMME_SYNOPSIS/PROJECT_INFORMATION/Partner'][p]['PROGRAMME_SYNOPSIS/PROJECT_INFORMATION/Partner/PARTNER_INFORMATION/PO1_EMP_hbeneficiaries'] != null) {
if (hbene1 < parseInt(jsonTemplate[f]['PROGRAMME_SYNOPSIS/PROJECT_INFORMATION/Partner'][p]['PROGRAMME_SYNOPSIS/PROJECT_INFORMATION/Partner/PARTNER_INFORMATION/PO1_EMP_hbeneficiaries'])) {
hbene1 = parseInt(jsonTemplate[f]['PROGRAMME_SYNOPSIS/PROJECT_INFORMATION/Partner'][p]['PROGRAMME_SYNOPSIS/PROJECT_INFORMATION/Partner/PARTNER_INFORMATION/PO1_EMP_hbeneficiaries'])
};
}
if (jsonTemplate[f]['PROGRAMME_SYNOPSIS/PROJECT_INFORMATION/Partner'][p]['PROGRAMME_SYNOPSIS/PROJECT_INFORMATION/Partner/PARTNER_INFORMATION/PO2_HA_hbeneficiaries'] != null) {
if (hbene2 < parseInt(jsonTemplate[f]['PROGRAMME_SYNOPSIS/PROJECT_INFORMATION/Partner'][p]['PROGRAMME_SYNOPSIS/PROJECT_INFORMATION/Partner/PARTNER_INFORMATION/PO2_HA_hbeneficiaries'])) {
hbene2 = parseInt(jsonTemplate[f]['PROGRAMME_SYNOPSIS/PROJECT_INFORMATION/Partner'][p]['PROGRAMME_SYNOPSIS/PROJECT_INFORMATION/Partner/PARTNER_INFORMATION/PO2_HA_hbeneficiaries'])
};
}
if (jsonTemplate[f]['PROGRAMME_SYNOPSIS/PROJECT_INFORMATION/Partner'][p]['PROGRAMME_SYNOPSIS/PROJECT_INFORMATION/Partner/PARTNER_INFORMATION/PO2_SA_hbeneficiaries'] != null) {
if (hbene2 < parseInt(jsonTemplate[f]['PROGRAMME_SYNOPSIS/PROJECT_INFORMATION/Partner'][p]['PROGRAMME_SYNOPSIS/PROJECT_INFORMATION/Partner/PARTNER_INFORMATION/PO2_SA_hbeneficiaries'])) {
hbene2 = parseInt(jsonTemplate[f]['PROGRAMME_SYNOPSIS/PROJECT_INFORMATION/Partner'][p]['PROGRAMME_SYNOPSIS/PROJECT_INFORMATION/Partner/PARTNER_INFORMATION/PO2_SA_hbeneficiaries'])
};
}
if (jsonTemplate[f]['PROGRAMME_SYNOPSIS/PROJECT_INFORMATION/Partner'][p]['PROGRAMME_SYNOPSIS/PROJECT_INFORMATION/Partner/PARTNER_INFORMATION/PO2_FPA_hbeneficiaries'] != null) {
if (hbene2 < parseInt(jsonTemplate[f]['PROGRAMME_SYNOPSIS/PROJECT_INFORMATION/Partner'][p]['PROGRAMME_SYNOPSIS/PROJECT_INFORMATION/Partner/PARTNER_INFORMATION/PO2_FPA_hbeneficiaries'])) {
hbene2 = parseInt(jsonTemplate[f]['PROGRAMME_SYNOPSIS/PROJECT_INFORMATION/Partner'][p]['PROGRAMME_SYNOPSIS/PROJECT_INFORMATION/Partner/PARTNER_INFORMATION/PO2_FPA_hbeneficiaries'])
};
}
if (jsonTemplate[f]['PROGRAMME_SYNOPSIS/PROJECT_INFORMATION/Partner'][p]['PROGRAMME_SYNOPSIS/PROJECT_INFORMATION/Partner/PARTNER_INFORMATION/PO2_FA_hbeneficiaries'] != null) {
if (hbene2 < parseInt(jsonTemplate[f]['PROGRAMME_SYNOPSIS/PROJECT_INFORMATION/Partner'][p]['PROGRAMME_SYNOPSIS/PROJECT_INFORMATION/Partner/PARTNER_INFORMATION/PO2_FA_hbeneficiaries'])) {
hbene2 = parseInt(jsonTemplate[f]['PROGRAMME_SYNOPSIS/PROJECT_INFORMATION/Partner'][p]['PROGRAMME_SYNOPSIS/PROJECT_INFORMATION/Partner/PARTNER_INFORMATION/PO2_FA_hbeneficiaries'])
};
}
if (jsonTemplate[f]['PROGRAMME_SYNOPSIS/PROJECT_INFORMATION/Partner'][p]['PROGRAMME_SYNOPSIS/PROJECT_INFORMATION/Partner/PARTNER_INFORMATION/PO2_MPPA_hbeneficiaries'] != null) {
|